Blog #5 in the Ingesting Data series. A step-by-step guide to adding Quine’s high-volume graph analytics inline with your Kafka-based event streams.
Ingest How-To: Real-time Graph Analytics for Kafka Streams with Quine
read more
Blog #5 in the Ingesting Data series. A step-by-step guide to adding Quine’s high-volume graph analytics inline with your Kafka-based event streams.

Cloud architectures enable a new level of integration with 3rd party systems and data sources to deliver the services our users and customers are looking for.

This blog shows you how Quine streaming graph can ingest multiple log formats to create a single, unified streaming graph for real-time analysis.

Ingest multiple data sources into Quine in order create a single streaming graph. ETL basics and Cypher queries are covered.

As crypto currencies go mainstream, better techniques for protecting users from fraud are needed. Enter streaming graph.

A step-by-step guide to ingesting data into Quine from live internet streams. ETL basics and Cypher queries are covered.

Part one in a series connecting different data producers to Quine streaming graph. Use Cypher to create ingest queries (ETL).
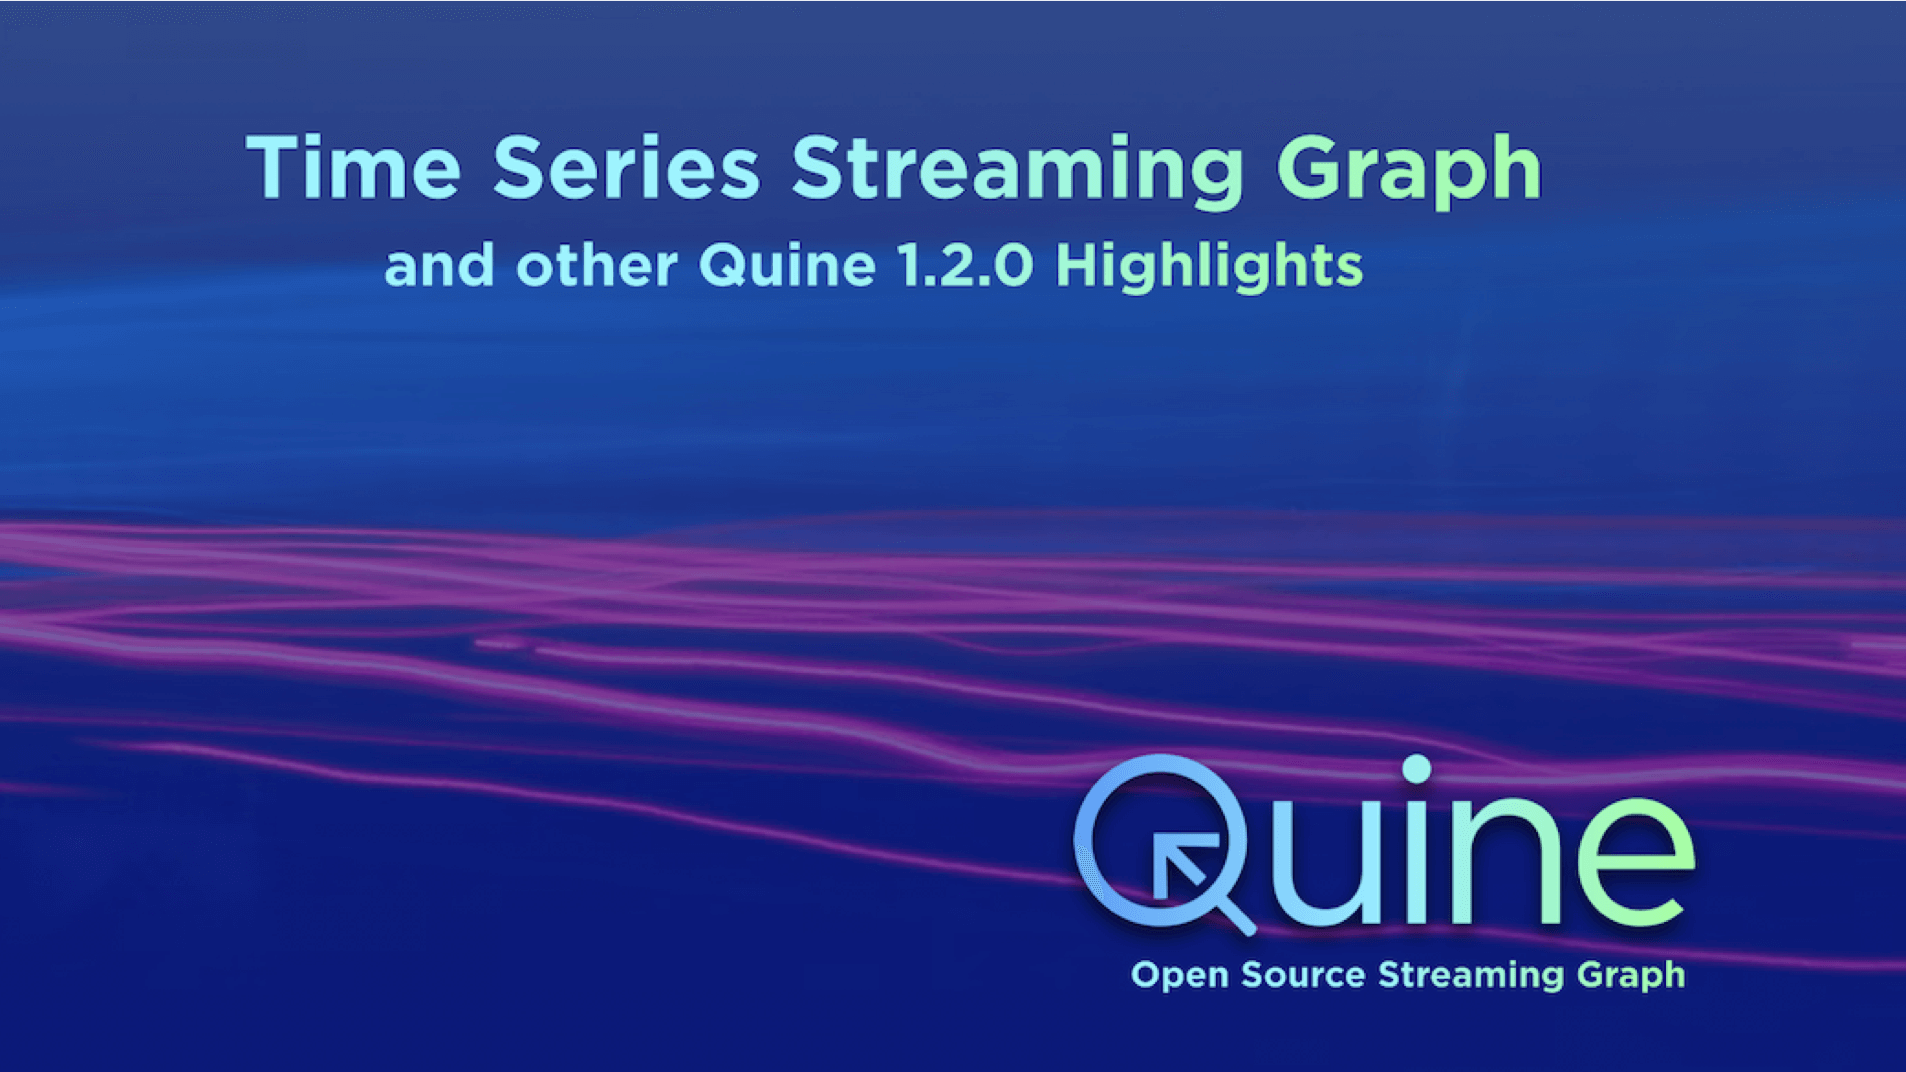
Quine 1.2.0 release sees significant new features, recipes, and performance enhancements.

Stop approaching streaming data the same way you do persistent data. Teach the stream to tell you when something interesting happens.
Advice and key concepts about Quine streaming graph that will accelerate your development.
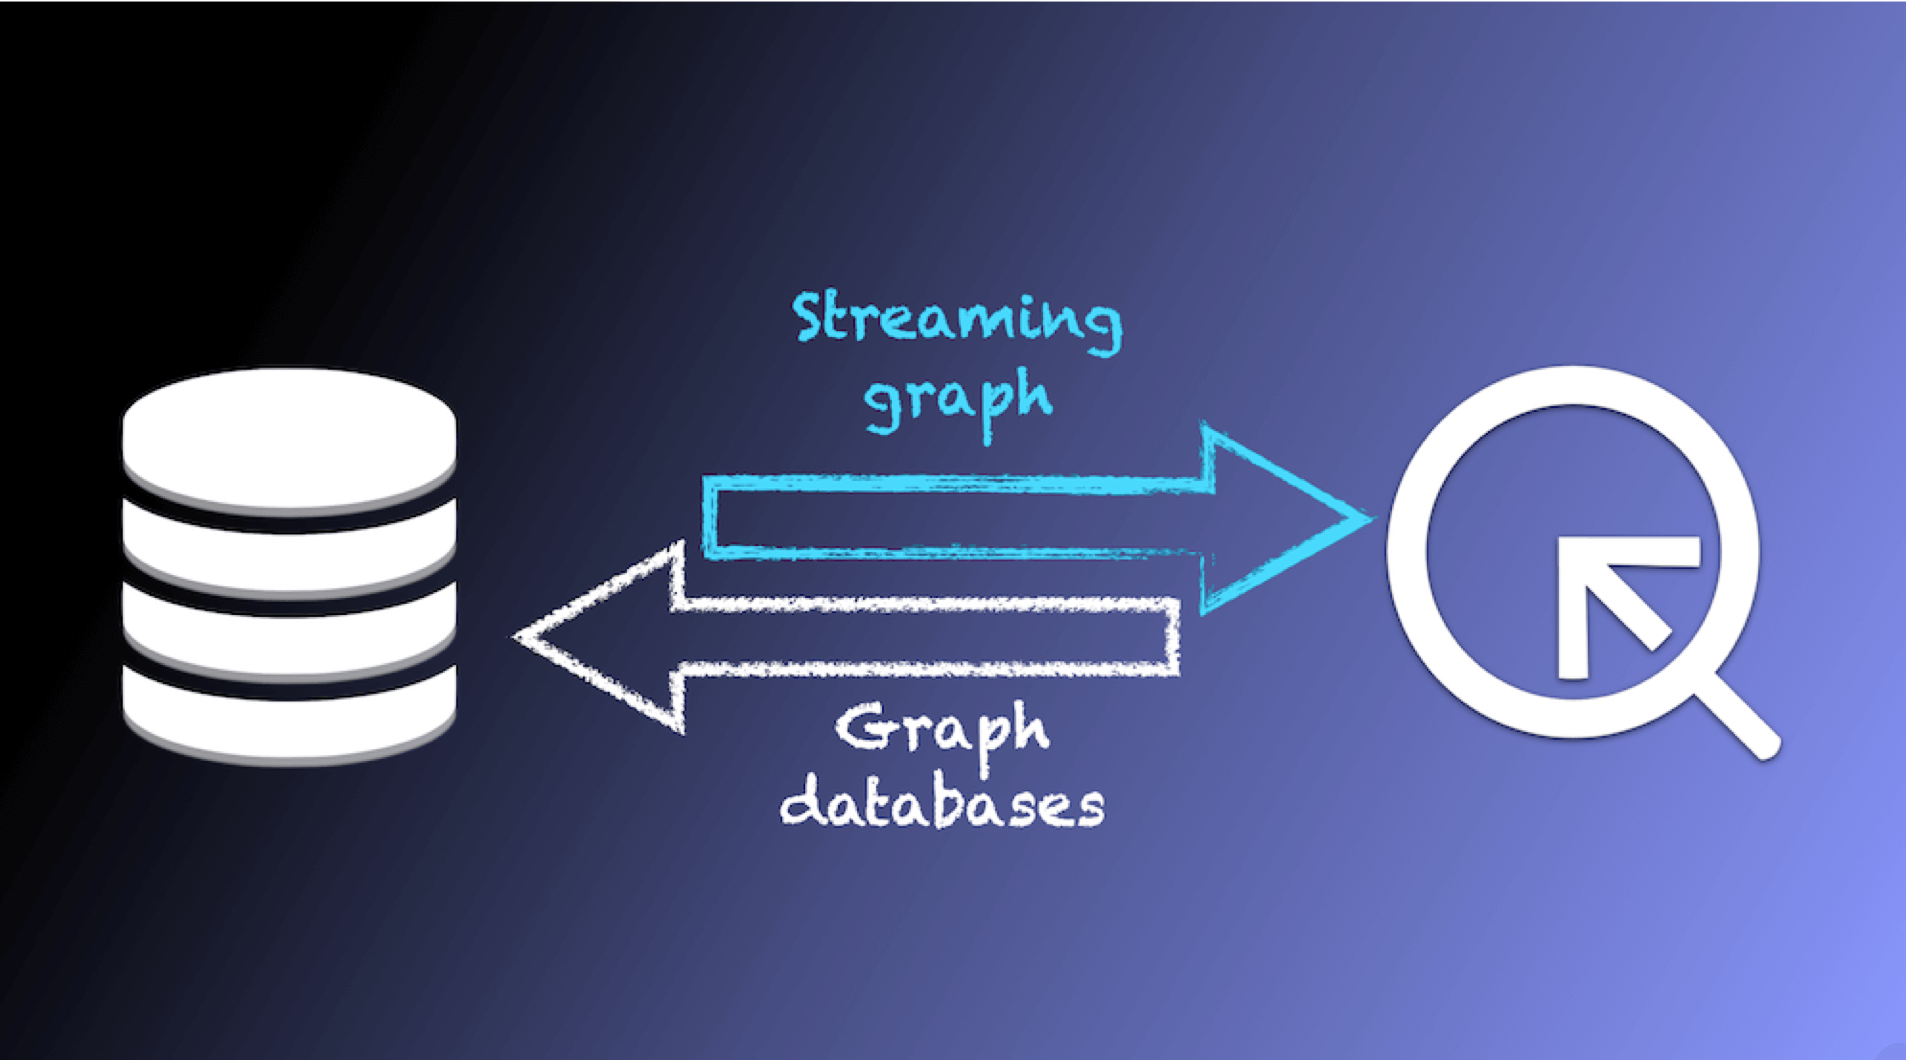
When it comes to event-driven applications, graph database users require a new approach: streaming graph.
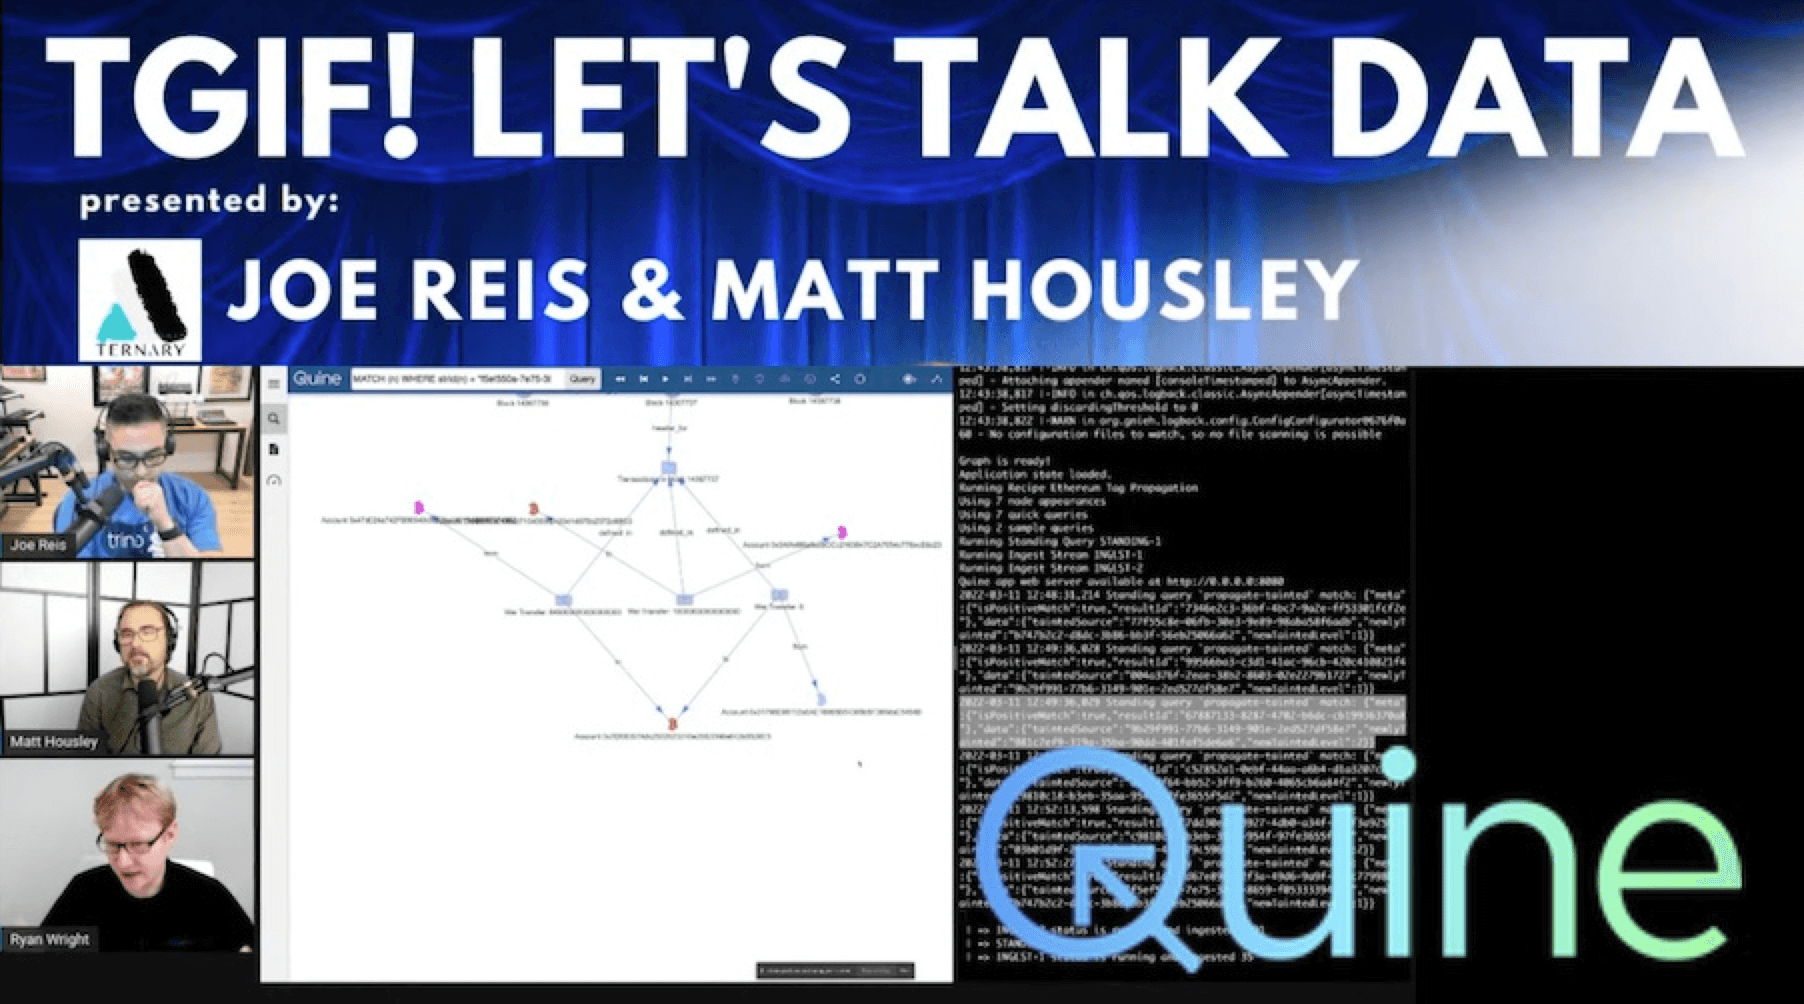
Ryan Wright (CEO of thatDot) joins Joe Reis and Matt Housley on the TGIF! Let’s Talk Data live show to chat about streaming graphs.
Quine Recipes make it dead easy to connect to your real-time event streams and turn them into stateful streaming graphs

Matthew Splett from Tripwire explains how he replaced complex SQL queries with succinct Cypher queries to process rollup data.
Bringing cloud-based data management into the enterprise data center, where much enterprise data still lives, is now simpler than ever.
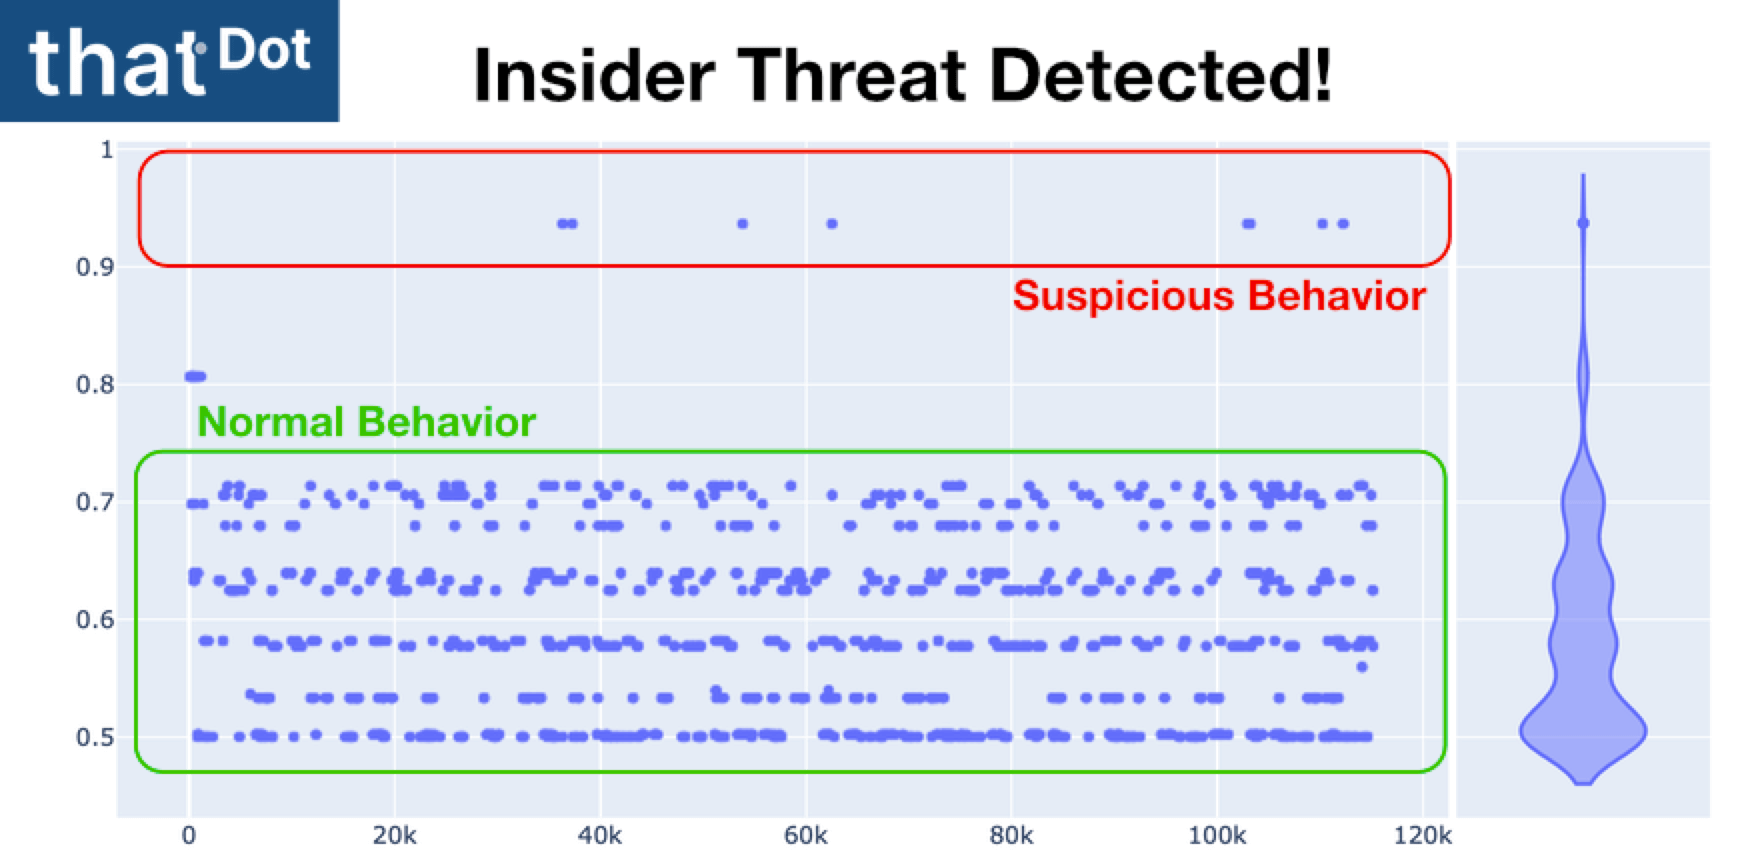
Advanced: Finding a malicious employee is one of the toughest cyber-security challenges in the industry.
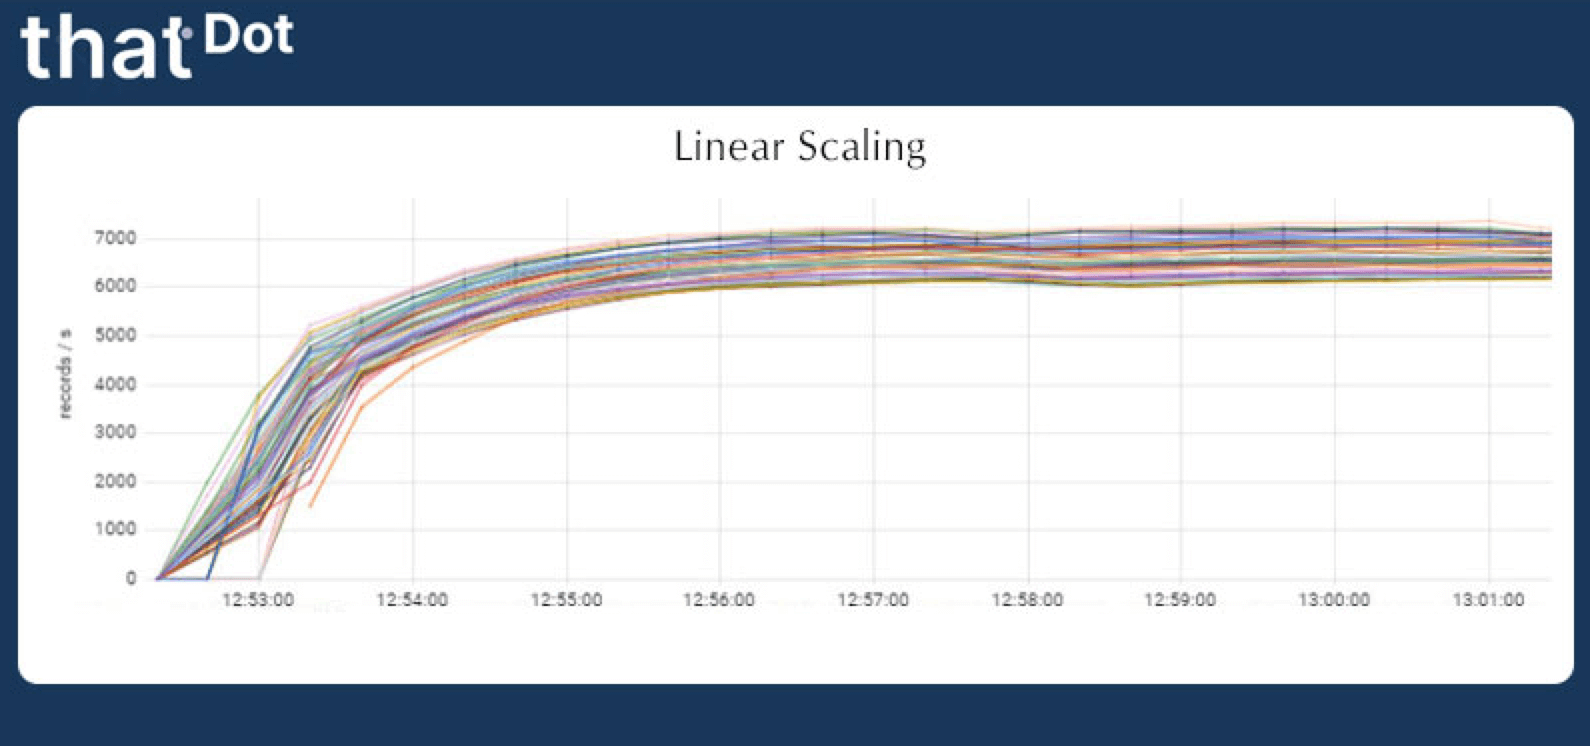
Learn how Quine streaming graph achieved a sustained rate of recording 425,000 records per second into our streaming graph.
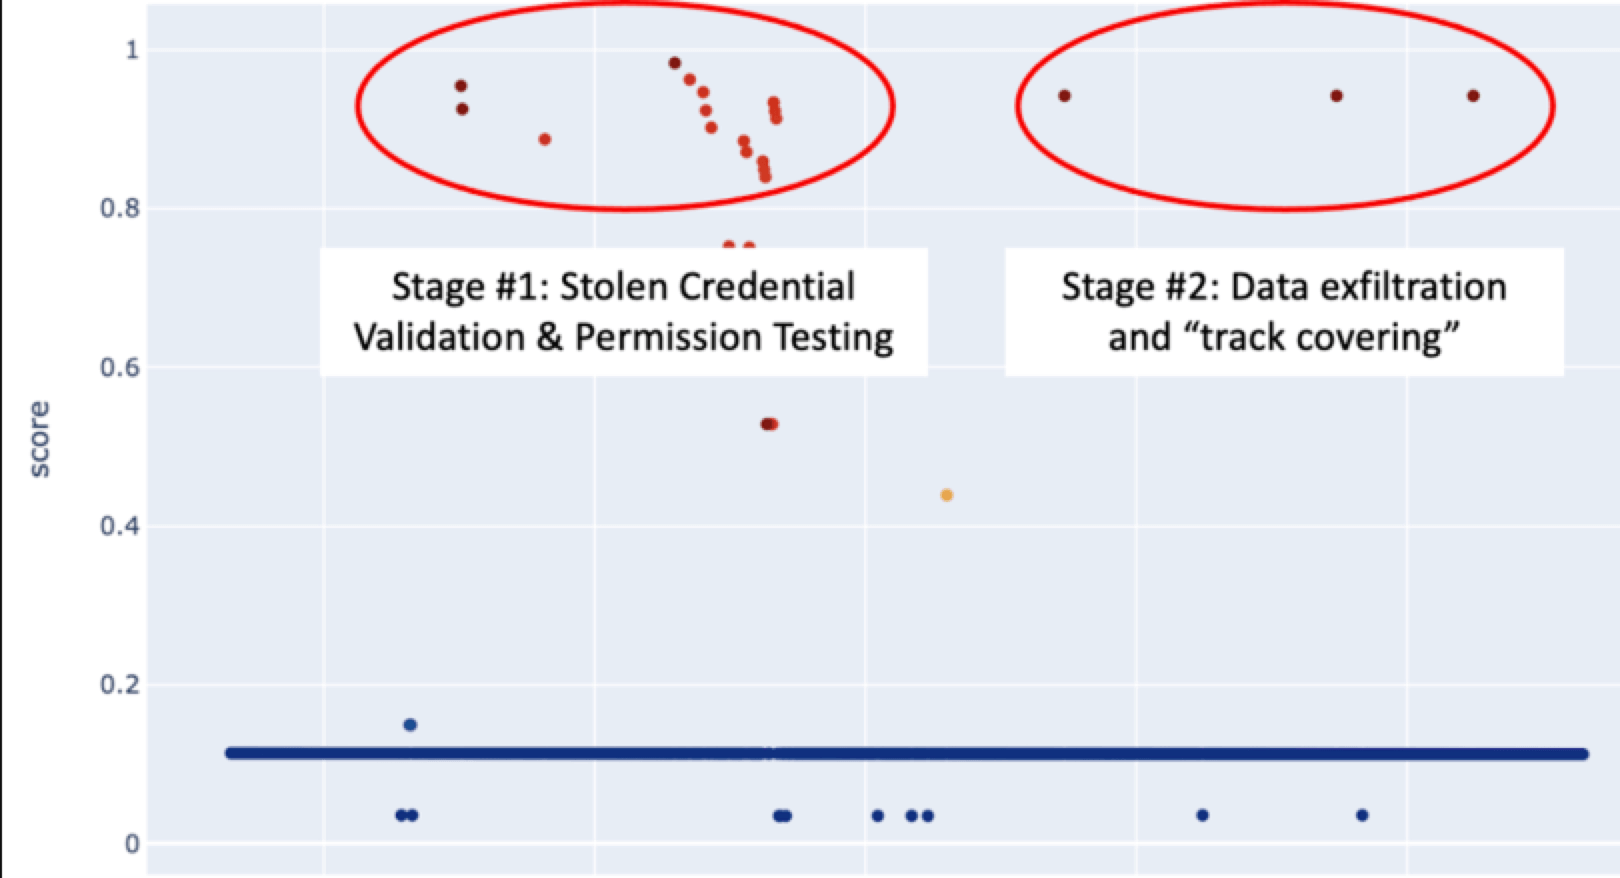
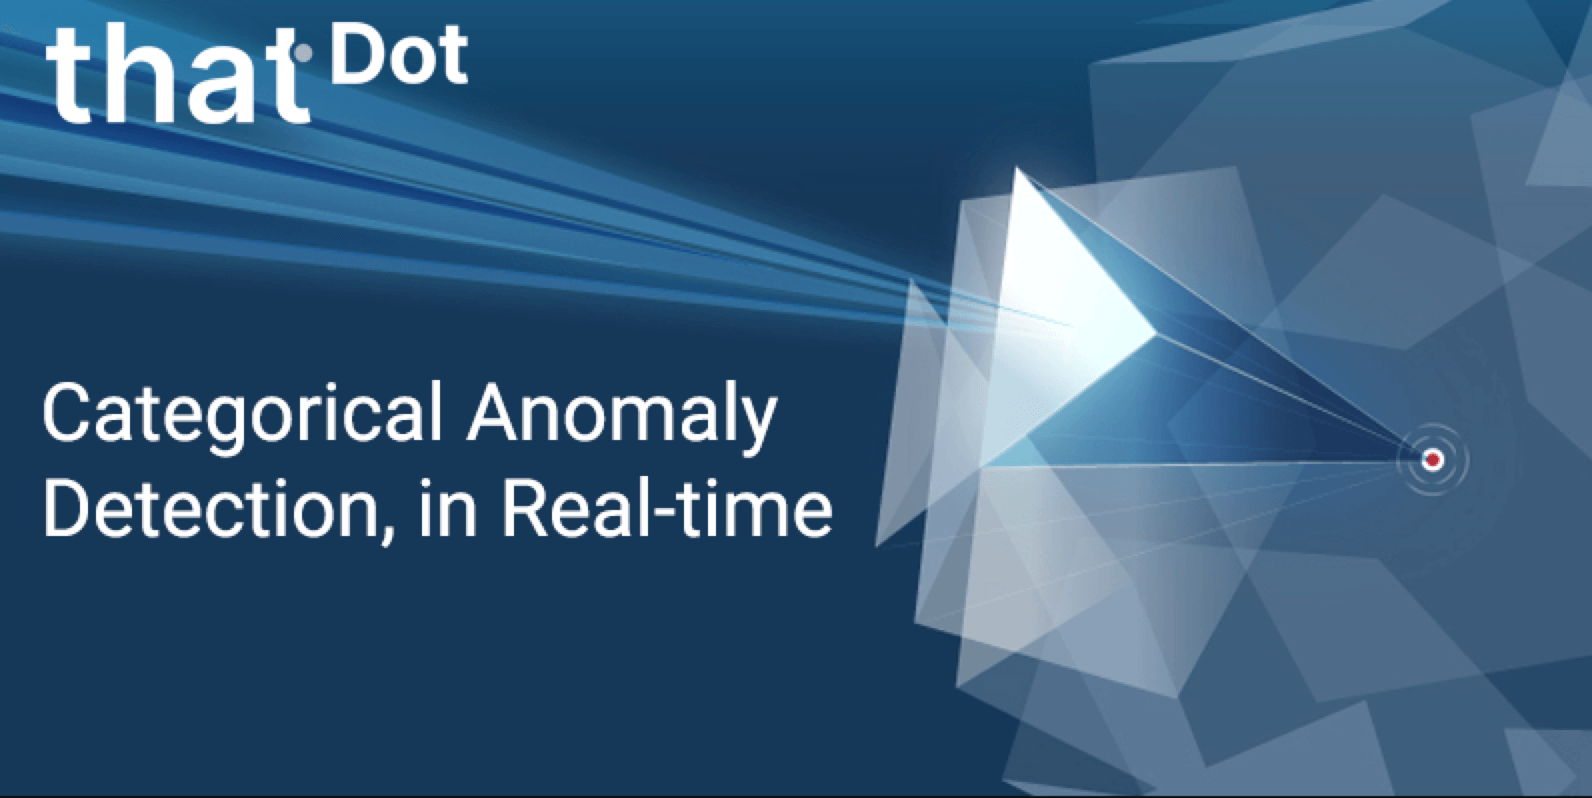
This blog on AWS data exfiltration detection explains the use of categorical data in anomaly detection to identify multi-stage exploit campaigns in AWS CloudTrail logs.
Destructive attack campaigns succeed because they integrate new techniques or new hardcoded credentials to access and victimize their targets.
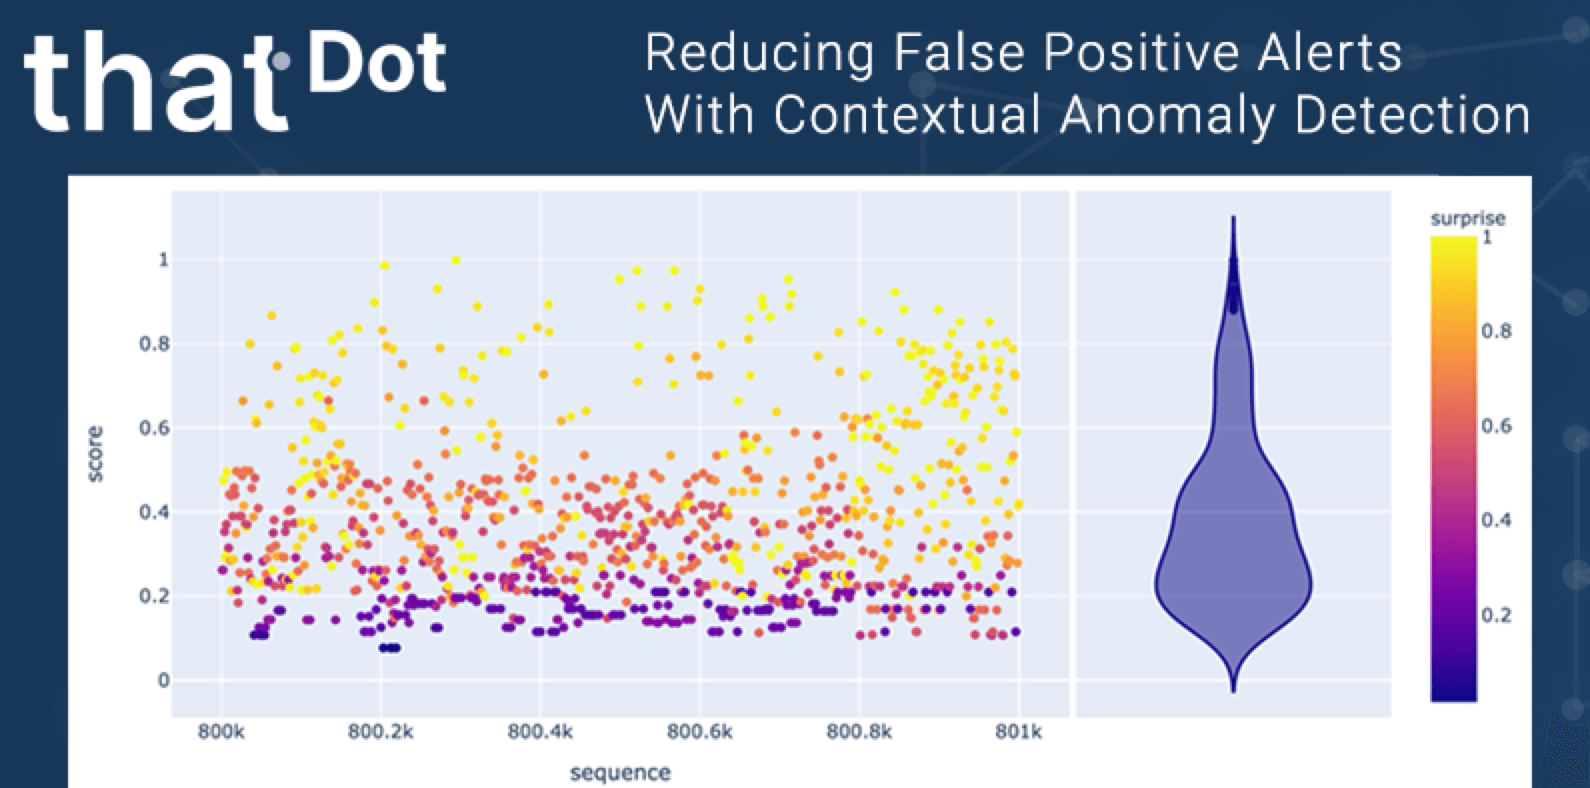
The move to the cloud represents new challenges for enterprise security teams. Use thatDot Novelty Detector to detect the attack quickly.
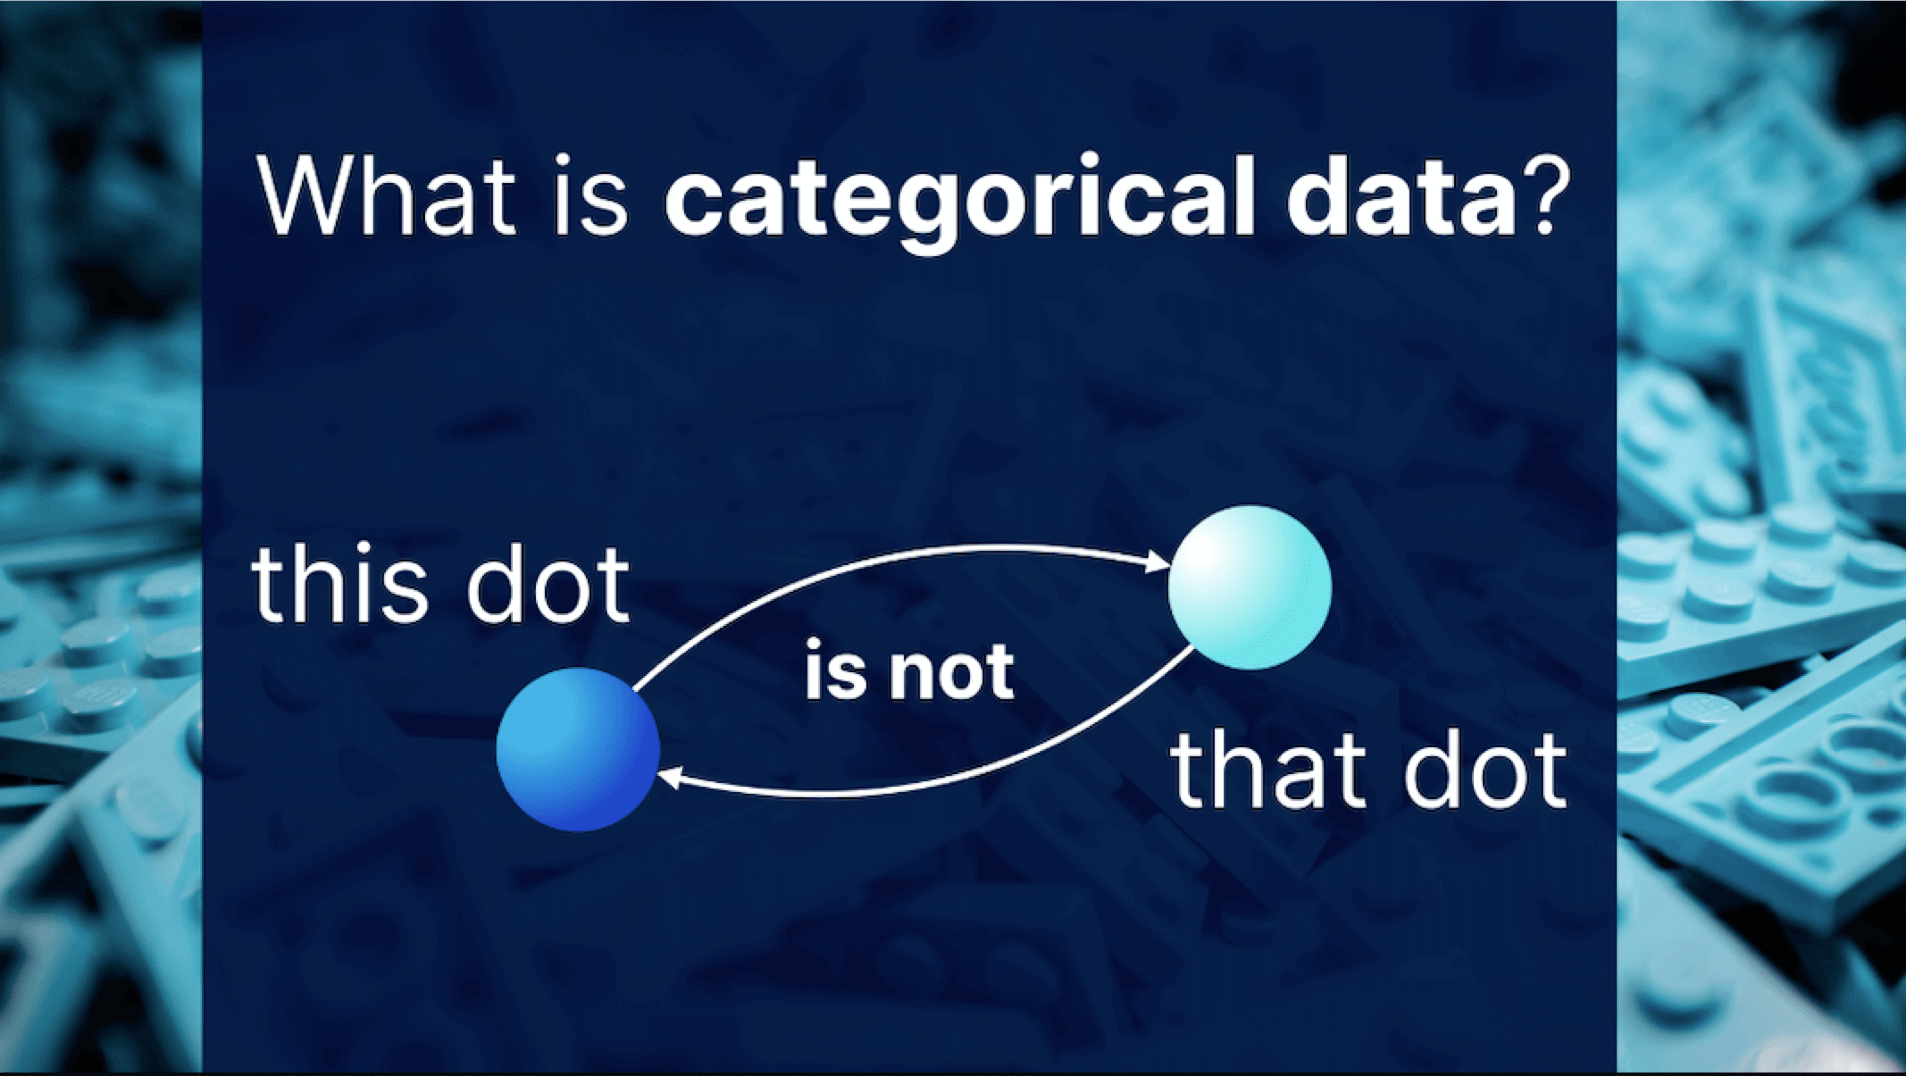
Data comes in two flavors: Numeric and Categorical. Numeric data is easy, it’s numbers. Categorical data is everything else.
thatDot’s real-time Novelty Detector for categorical has updated its data exploration and data transformation capabilities.
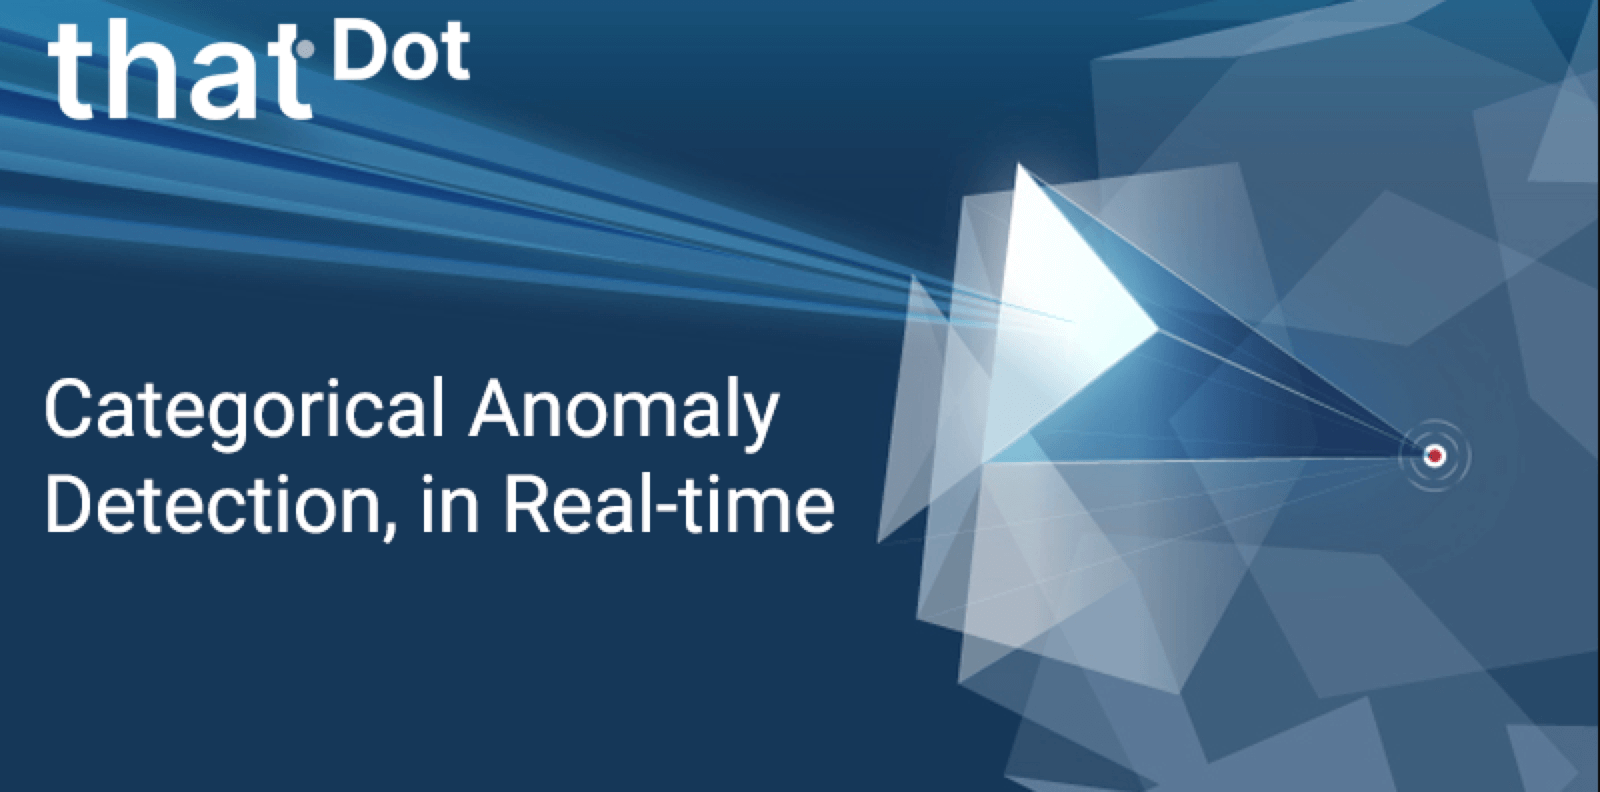
thatDot is excited to share the general availability of the world’s first system for real-time categorical anomaly detection.
We introduced the term “3D Data” as a mnemonic and a way to think about streaming data processing that incrementally builds toward human-level data questions.
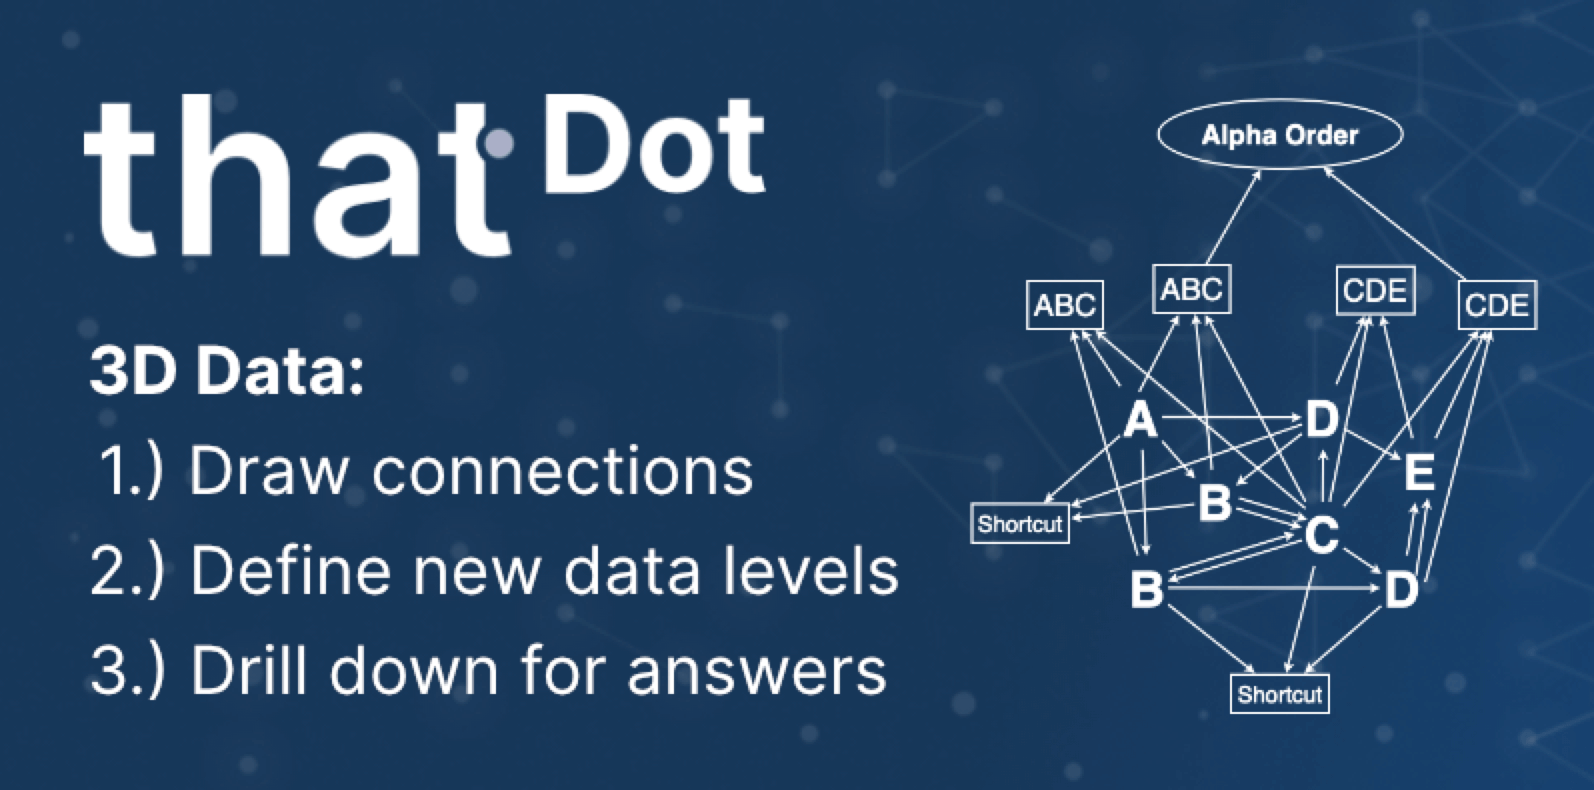
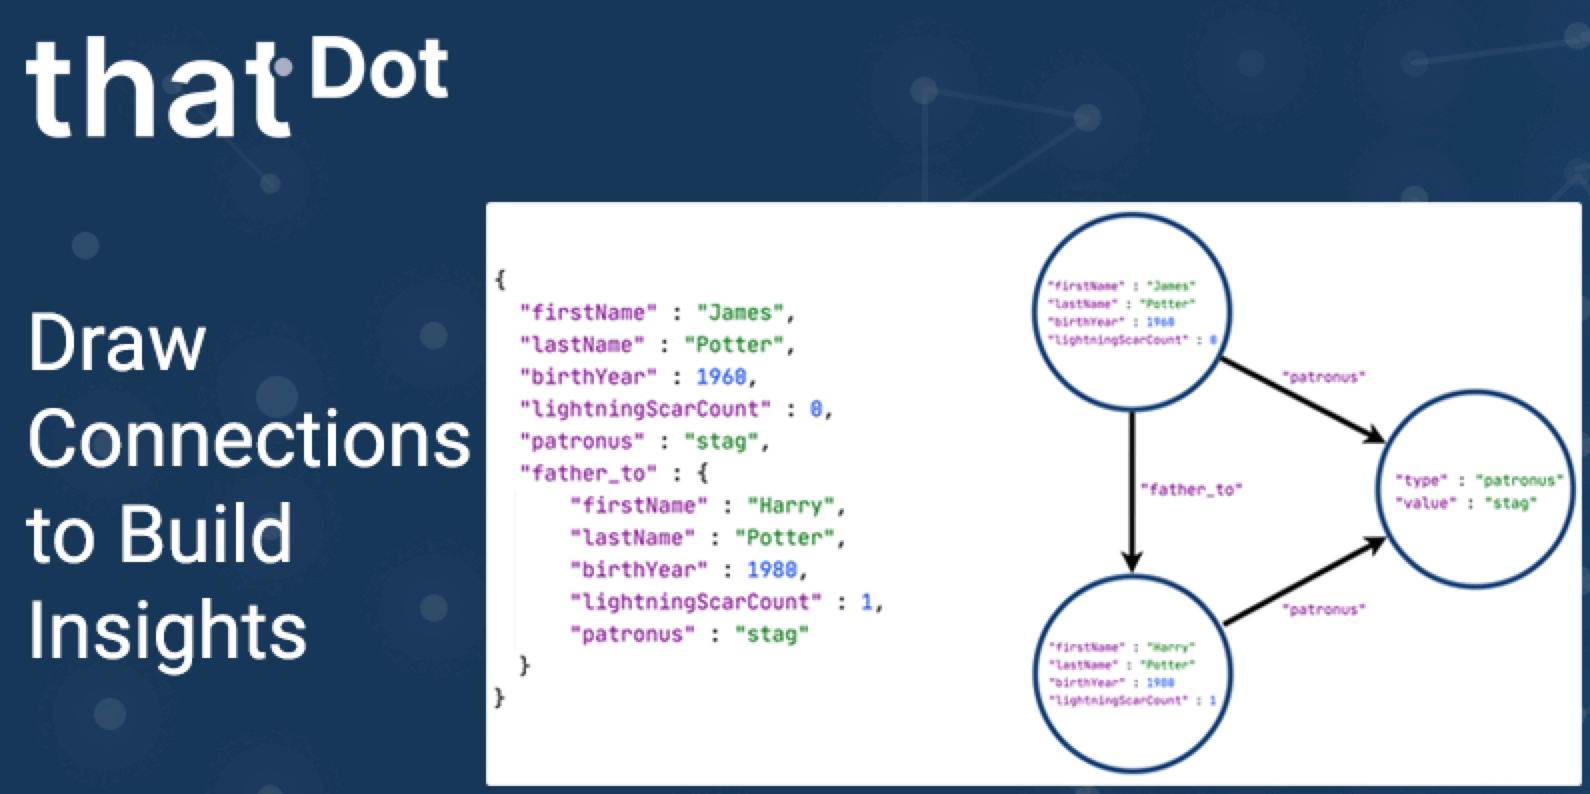
Draw Connections, Define Data, Drill Down
Imagine if the next time your video streaming operations dashboard-of-choice warns you that 100 users experienced video start failures in the last minute,