In the first post in this series, we introduced the term “3D Data” as a mnemonic and a way to think about streaming data processing that incrementally builds toward human-level data questions with the power for deep contextual explanations (e.g. “Is my system running well?”). In this post, we dive deeper into the first “D”: Draw Connections, to further explore the benefits for data analysis and the groundbreaking result for streaming computation.
Connections for Data Structure
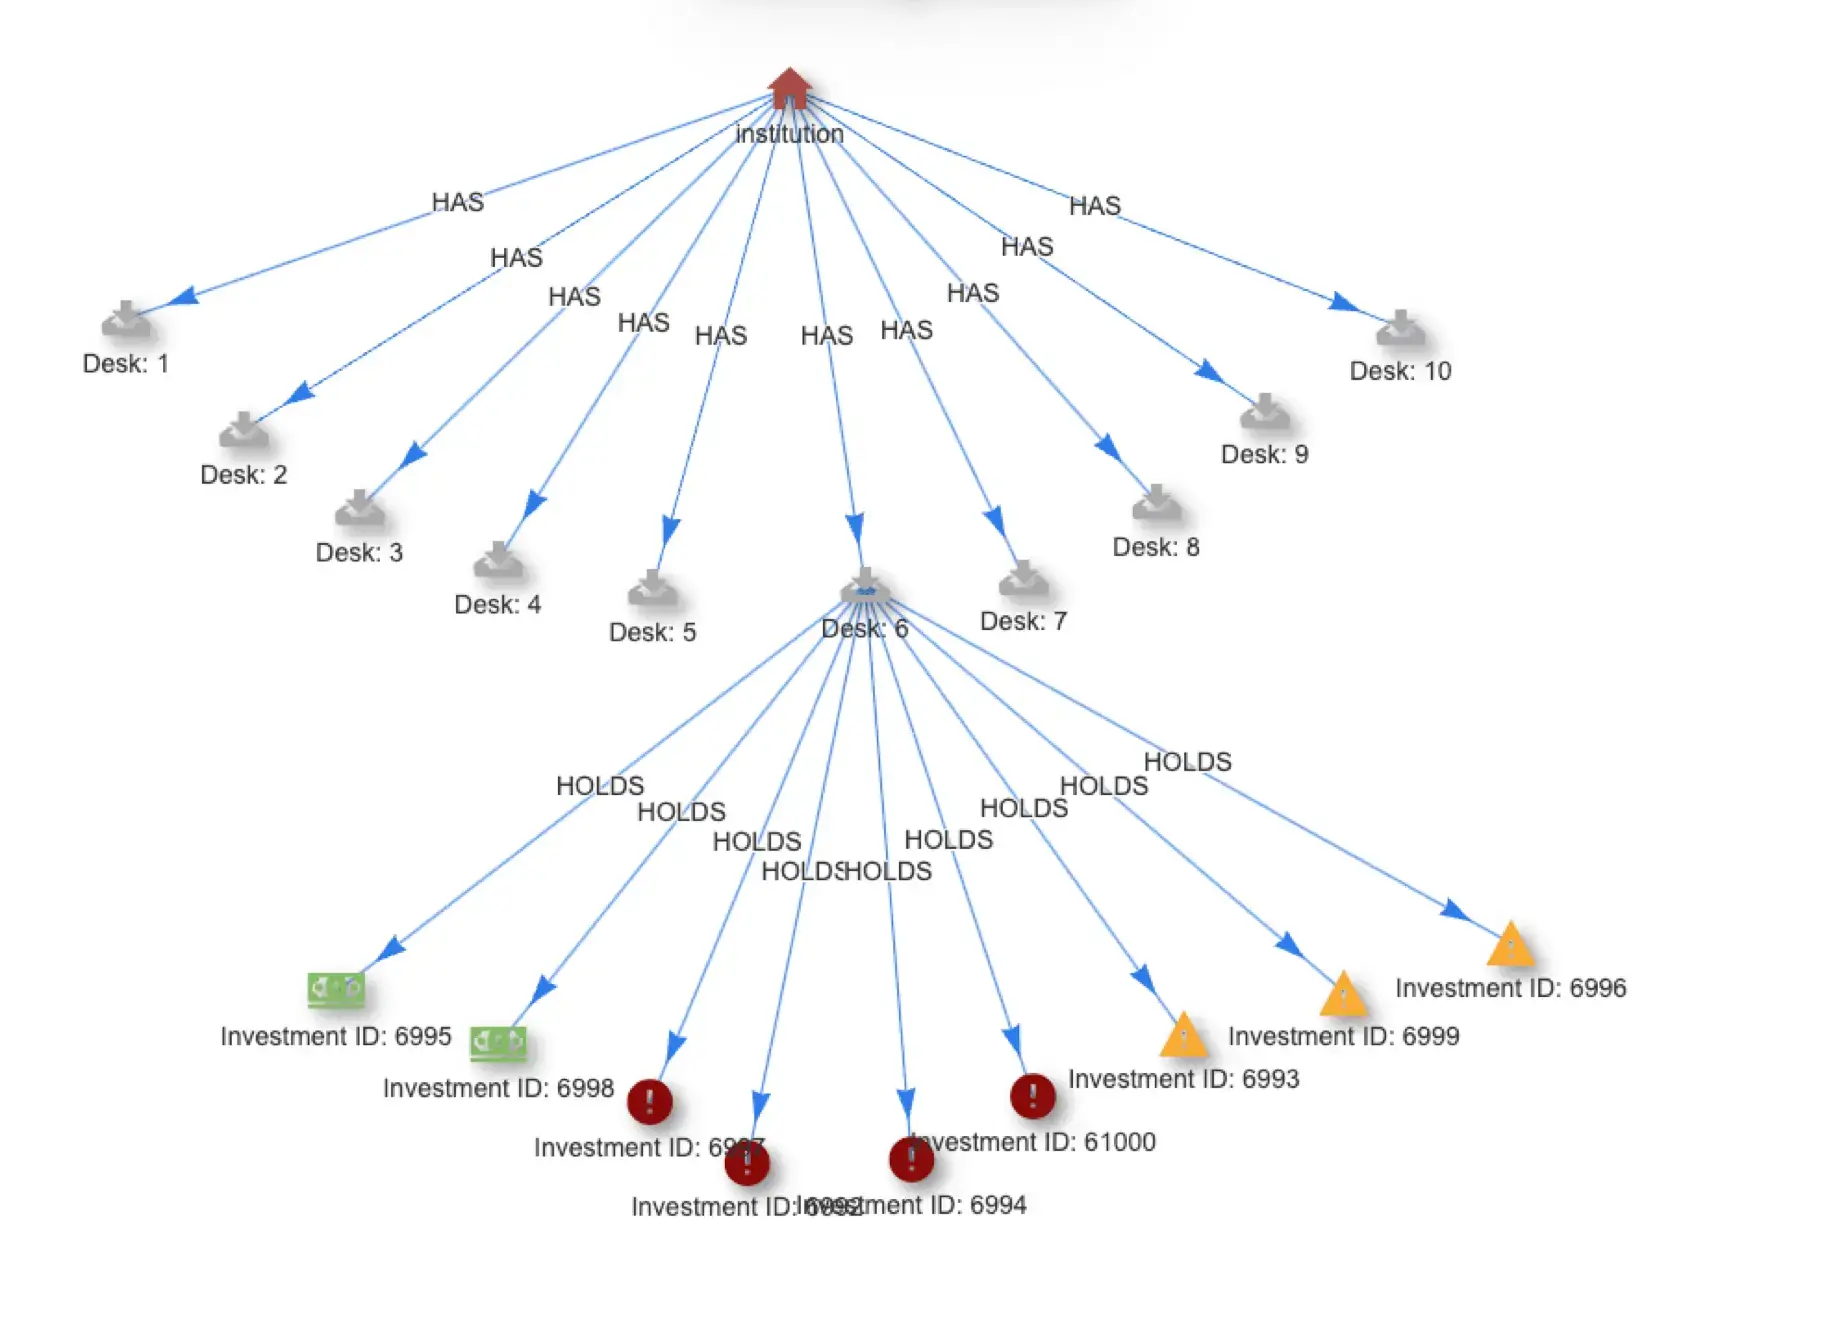
Data is related to other data, and there is value in drawing those connections explicitly; that’s the premise. In practice, this means using edges in a graph structure to encode some of the data[1]. A Node-Edge-Node pattern in a graph corresponds to an Subject-Predicate-Object pattern in natural language. So when we talk about creating edges between nodes, it’s best think of that edge as a predicate.

Data used for edges usually comes from two sources: 1.) values given in the data itself, and 2.) tacit knowledge about what the data means.
Data values as connections
Let’s assume JSON objects are the input data format for a stream processing system. Every new object is a new piece of data to be considered by the system. If a NoSQL document store is used, then you can simply save the object as a new item in your document store. However if you do that, you will need to traverse the object to understand how it’s values are related to other objects in the store[2].

An alternative data representation would treat the JSON object as a node in a graph. The key/value pairs in the JSON object become properties on a node. But with a graph structure available, we have a new data modeling choice: an option to take a property from the JSON data and encode it as an edge to another node. The JSON key is used to create the edge label and the value is stored in the node on the other end of the edge[3]. The choice of which properties to pull out into separate nodes is a data modeling choice. So is the decision to use a single node for all occurrences of the value (i.e. from multiple different JSON objects) vs. a separate node for each occurrence of the same value.


This method becomes especially interesting and powerful when applying it to nested JSON objects. Instead of each nested object treated opaquely as blob, the inner JSON object is the definition for a new collection of properties on a different node—with the edge labelled with the nested object’s key. This process can occur recursively as much as needed.

Tacit knowledge as connections
In addition to the obvious data being the source of connections between data elements, we have often found it useful to reify other assumed knowledge into specific nodes in the graph and connect them to other data. A trivial example might be to create nodes to represent the buckets of time that are relevant to the problem (days of the week, morning/afternoon/evening/night, every second, etc.), and then connect the associated data with those time buckets.
Creating a node to represent an item of tacit knowledge provides a location to store other data for relevant conclusions. Drawing conclusions from that data will be discussed more in the next post in this 3D Data series.
There are many kinds of tacit knowledge, and many kinds of data we often use but don’t literally represent. Choosing insightful examples is very application-specific, but considering the kinds of answers for which the data is being used is often illustrative. In our experience, there are often intermediate objects like “user” or “session” which are the subject of qualitative questions (e.g. “Did all users have a good experience?”) that are easily overlooked when considering data representations. These intermediate objects are easy to overlook because they aren’t the direct subject of any single piece of data but instead are the object or concept that is behind either the data or the questions. Reifying these objects makes them available for computation, as a place to store intermediate answers, and core components in meaningful explanations.
Connections for Computation
The data modeling techniques described above are often enlightening and useful. They can be applied across a broad collection of technologies. Relational databases or document stores can simulate graphs, with some extra computation. Joining two tables in a relational database is akin to traversing across the edges in a graph. This works well for batch operations; but we built thatDot Quine specifically to operate on streaming data. So instead of using extra computation to simulate a graph, we turn this on its head and use less computation over a graph to get iterative results we can produce in real-time.
The result of iterative processing on a native graph means that we can make use of a technique called “semantic caching.” Semantic caching is a technique that uses the structure of the data to inform how computation should be performed. While this topic deserves its own separate discussion, we leave a mention here as a pointer to the deeper computational motivation for drawing connections in data. For those who can’t wait, we touch on this topic and other related concepts in the technology overview section, and our solutions team is always ready to discuss applications to your problem space.
Both for data modeling and stream processing, the first step for realizing 3D Data is the same: Draw connections between data. You already have the data. Pulling out edges from that data and encoding other aspects you already know is a brilliant way to get started building powerful real-time answers with context to human-level questions.
[1] We are assuming a property-graph model where nodes in the graph are distinguished with IDs and contain a set of key-value pairs called “properties”, and edges connect exactly two nodes and have an edge label with an optional direction. Variations on the property-graph model are in wide use in differing contexts. Sometimes edges themselves are allowed to have properties as well as nodes, but in our model, we do not assume that is always true.
[2] Most object stores will index some values in these objects so they can be found more easily. This is an important step, but does not change the structure of the data stored. The need to pick carefully choose what to index becomes a critical consideration.
[3] This is very similar to how the W3C RDF spec represents what are often stored as node properties. https://www.w3.org/TR/rdf-schema/#ch_properties


