Resources

The Secret Ingredient in the Alphabet Soup of Cybersecurity
This is the first in a series of blogs exploring how the Quine Streaming Graph analytics engine is the secret ingredient in the Alphabet Soup of cybersecurity, enabling faster, more accurate detection of complex threats without compromising on the type or volume of data analyzed, the fidelity of alerts or response time. The Dilemma of Data in Cybersecurity As we all know, the letter combinations in cybersecurity continue to grow, sometimes falling out of view, floating just under the surface,...

Streaming Graph Get Started
It's been said that graphs are everywhere. Graph-based data models provide a flexible and intuitive way to represent complex relationships and interconnectedness in data. They are particularly well-suited for scenarios where relationships and patterns are important, but until recently, they have been confined to a handful of use cases – databases, chip design, information theory, AI – that all have one thing in common: the data in question is stored first and then processed, usually as a batch...
Streaming Graph for Real-Time Risk Analysis at Data Connect in Columbus 2024
After more than 25 years in the data management and analysis industry, I had a brand new experience. I attended a technical conference. No, that wasn’t the new thing. At many conferences, I’ve been surrounded by data scientists, business analysts, data engineers, mathematicians, developers, startup founders, CTO’s, architects, and PHD students, made network connections, listened to giants in the field, like the Chief of Information Management of the United Nations at this one. But, uniquely,...

Cypher all the things!
Uses for individual data engineering technologies are often broadened to more than just interacting with databases. The same goes for graph database techniques and, specifically, the leading language for building and querying graph databases – Cypher.
thatDot CEO Explains Streaming Graph to Cybersecurity Thought Leader
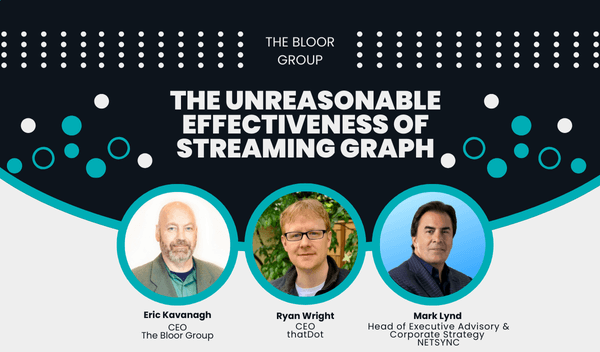
Briefing Room on demand webinar on thatDot Youtube channel: The Unreasonable Effectiveness of Streaming Graph thatDot founder and CEO Ryan Wright discussed the power of thatDot Streaming Graph and Novelty to detect the most well-hidden threats with the Bloor Group's Eric Kavenagh and Mark Lynd, who was ranked #1 global thought leader in cybersecurity by Thinkers360. With high-profile data breaches hitting the headlines every other day now, the way we're doing this is clearly a losing battle....
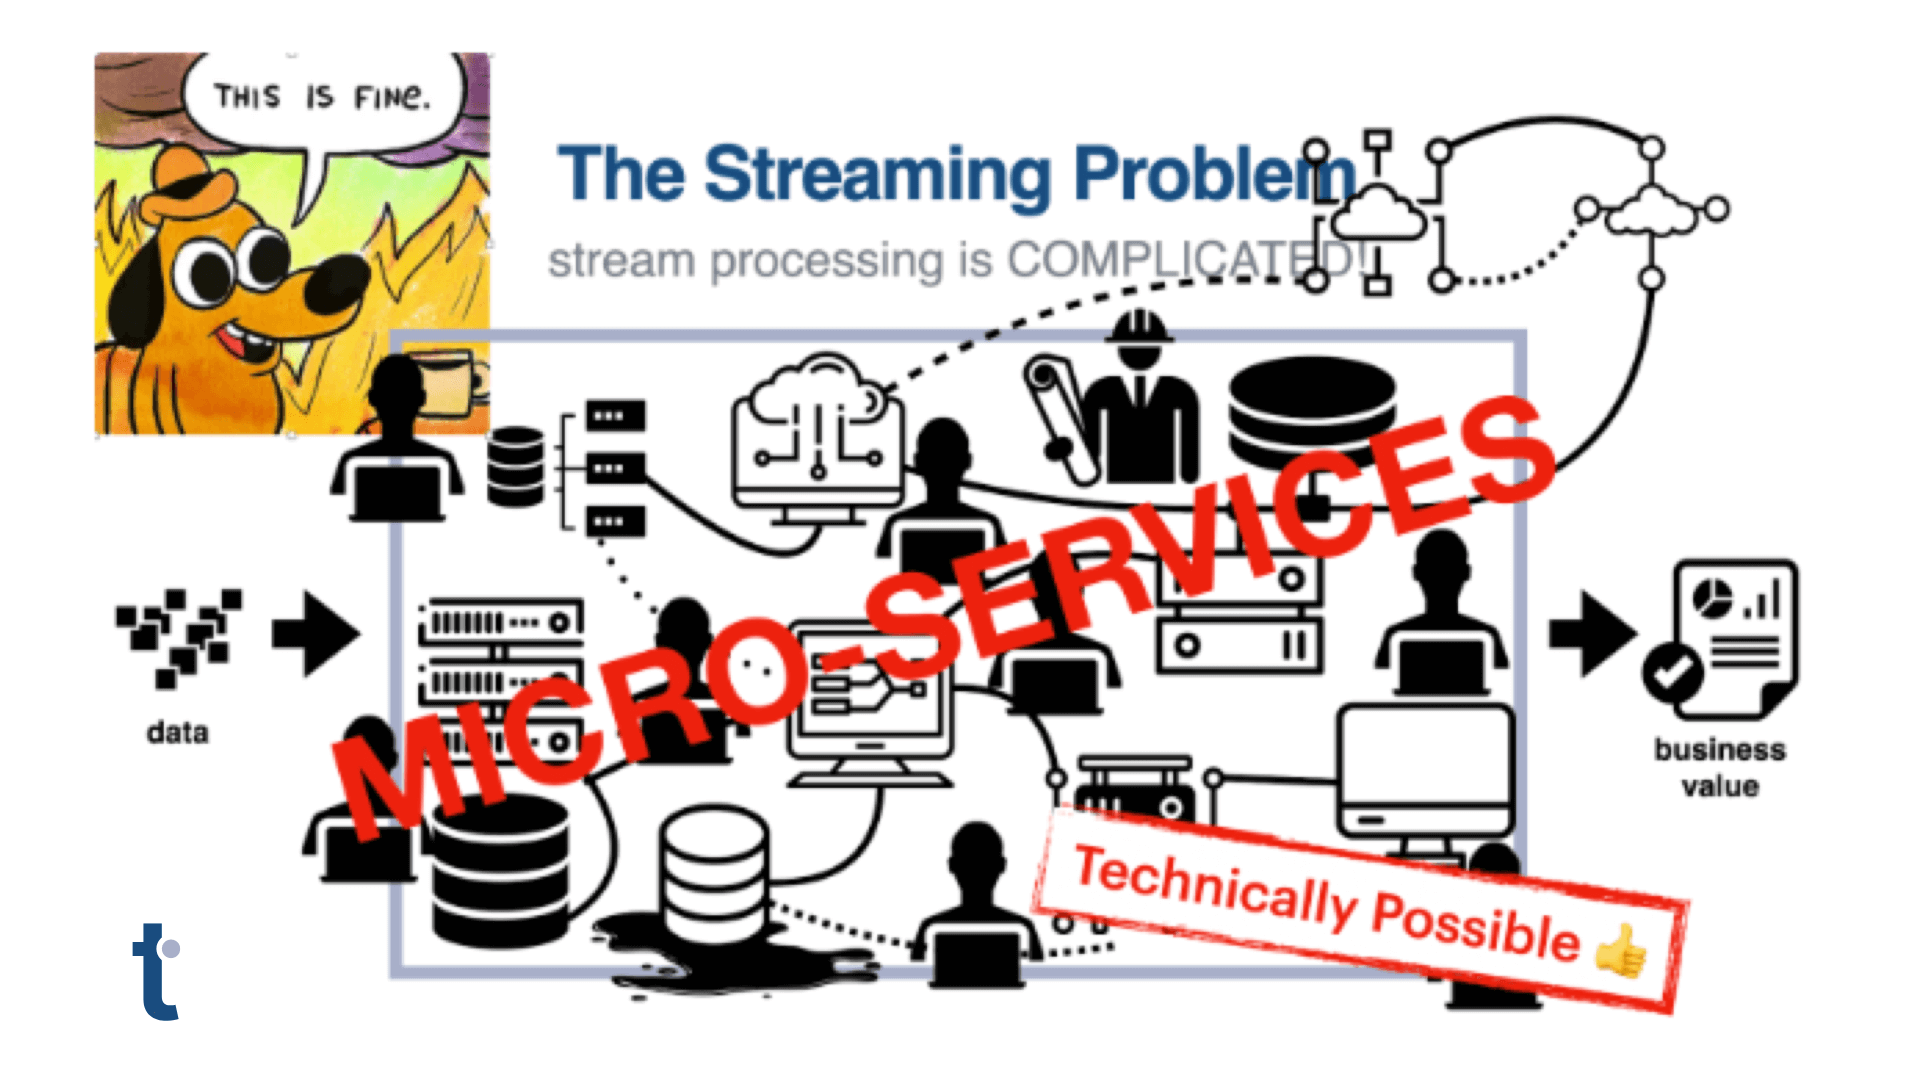
Microservice Hell: The State of the Art in Streaming Services
Exploring the challenges of data processing in microservices, the article introduces thatDot’s Streaming Graph, which seamlessly integrates various data sources like Apache Kafka, AWS Kinesis, and more.
Novelty Demo
Novelty Tutorial https://youtu.be/JuvAjtTmLa8?feature=shared This 12 min video demonstration walks through a Jupyter notebook powered scenario illustrating how to use thatDot Novelty to analyze CDN logs for anomalous activity. Click here to download the CDN dataset for this example.Download the Jupyter notebook and try the demo yourself with an AWS instance of thatDot Novelty. Demo Summary Novelty Score Endpoints The demo interacts with thatDot Novelty through its interactive REST API. You...

Real-time Blockchain Fraud Detection
The Problem Real-time linking of transactions, accounts, wallets, and blocks within and across blockchains is not possible with current solutions. Instead, the user must either rely on batch processing, which means results are out of date, or perform recursive lookups across table joins, which means unacceptable latency. The Solution Graph data structures are ideal for modeling the relationships described in blockchain events. Flows of cryptocurrency between accounts and wallets are ideal...

Authentication Fraud
The Problem Metered attacks that generate low volume log-in attempts, from diverse IPs and across extended time frames, are designed to avoid the "3 strikes in 24 hours" business rules in authentication applications and the more complex analysis of log analytics / SIEM platforms. Batch solutions by definition cannot react until after a compromise has occurred while all real-time solutions impose time windows -- any data falling outside these rolling windows, no matter how important, is simply...

Financial Fraud Detection
The Problem Financial fraud detection requires monitoring billions of transactions, devices and users in real-time for suspect behaviors without false positives that alienate customers when service is denied in the middle of a foreign vacation or late night business event. The Solution What is needed is a system that do four things: detect complex patterns of behavior combine multiple sources and scale up to millions of events/sec take the appropriate, user-specified action when patterns are...

Video Observability for Root Cause Analysis
The Problem Real-time video observability that can solve Quality of Experience (QoE) issues while live broadcast events are still playing require the simultaneous monitoring of millions of data points. Video sessions flow across multiple systems including origins, CDNs, manifest services, and players provided by multiple vendors. Relational database approaches to perform this complex log analysis at productions scale run into costs constraints that prohibit comprehensive real-time operations...
Streaming Graph ETL
The Problem Most ETL tools use the batch processing paradigm to find high-value patterns in large volumes of data. Whether the specific business application is fraud detection, cyber security, network observability, e-commerce or ad targeting, batch processing translates into delay. Even if you are processing data in small batches, you are missing opportunities to react to events as they happen and shape outcomes in ways beneficial to your business. A great example is insider trading. The cost...

Log Analysis
The Problem Monitoring systems comprised of multiple services is typically done by monitoring each service individually using it's logs, or on an end to end basis that lacks visibility into the individual performance characteristics of each service. Root cause analysis is usually based on operations personnel instinct and past experience, making automated remediation next to impossible for many use cases. The Solution With thatDot's streaming graph logs and events from servers, operating...
Graph AI
The Problem Pick One. Recent AI research is generating a growing number of graph AI techniques that take advantage of graph data relationships, and the rich context it provides, however production graph data pipelines lack the performance needed to deploy these new tools at scale. Graph AI development promises significant advances for AI application to a range of use cases thanks to the rich data context available from a graph data model. Moving graph AI techniques from the lab to production...

Stateful Digital Twin
The Problem While digital twins and the emerging subcategory of asset graphs promise operators greater visibility into the relationships between IT assets and equipment under management, current approaches are more like snapshots of a point in the past. Events take place in real time, meaning the digital twin is almost always out of date, limiting its utility. Lack of visibility translates into delayed reactions to threats or failure modes. Digital twins are out of step with enterprises...
Real-Time IoB Threat Hunting
The Problem Modern threat detection requires data – lots of data – typically from multiple sources. This brings with it a number of interesting data engineering challenges, especially when we want to materialize that data into a single view and execute analysis in a timely and cost-effective manner. Finding indicators of behavior (IoBs) in real time amplifies already significant challenges: processing enough of the right kind of data from multiple sources in a timely fashion is beyond the...

Advanced Persistent Threat (APT) Detection
The Problem Discovering advanced persistent threats (APT) is, by design, akin to finding a needle in a haystack. The threat actors behind APTs combine multiple tactics, techniques, and procedures (TTP) over extended periods of time to compromise and maintain access to their targets. The IBM Cost of Data Breach Report 2021 reported an average attacker dwell time of 212 days. APTs evade legacy security solutions which rely on time-batched loads of data that filter for Indicators of Compromise...

Real-time AWS CloudTrail Threat Detection
The Problem AWS CloudTrail logs are full of untapped information that can help reduce risk and improve event response times, especially when analyzed in context and in real time. A thatDot cyber security customer seeking to expand their offerings to include threat detection monitoring of AWS CloudTrail logs faced three challenges. They needed to: Reliably identify hard-to-detect insider and external threats using Indicators of Behavior (IoB) analysis Generate highly informative alerts that...

Novelty Technology
Introduction: a New Approach to Anomaly Detection Anomaly detection is a technique for finding important data. Decades of research has been spent on creating tools for anomaly detection with numeric data. But most data produced in the real world is not numbers—it is user names, identifiers, log statements, email addresses, URLs, access credentials, service names, file paths, timestamps, IP addresses, API paths, and a seemingly endless list of valuable data that is not a number. Non-numeric...

4 Advantages to Streaming Analytics in Graph Form
Explore the transformative benefits of streaming analytics in graph form, including real-time insights, deep relationship analysis, immediate categorical data processing, and drastically reduced mean time to value (MTTV).

The Future of Modern Threat Hunting is Streaming Graph
Standards-based threat detection & automated response using Quine streaming graph.
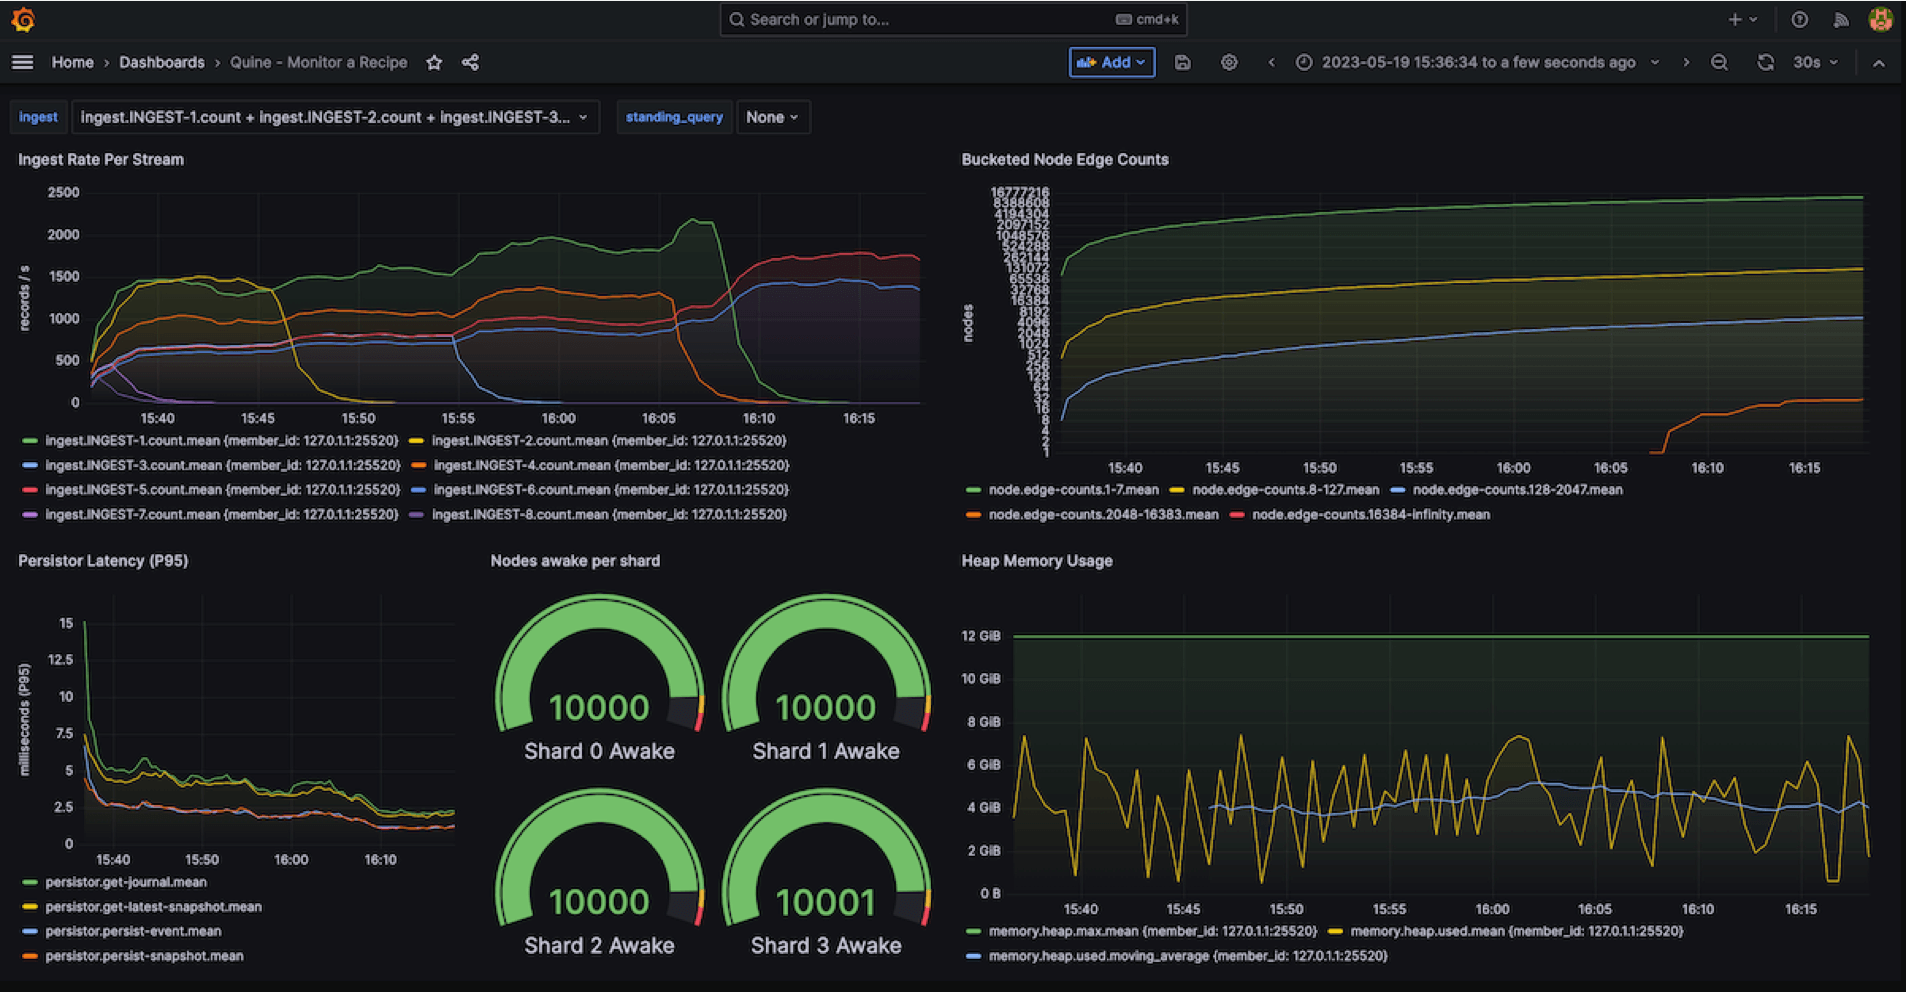
Monitoring Quine Streaming Graph using Grafana + InfluxDB
Monitoring tools like Grafana work well with Quine but there are a few things to keep in mind when monitoring data in motion.
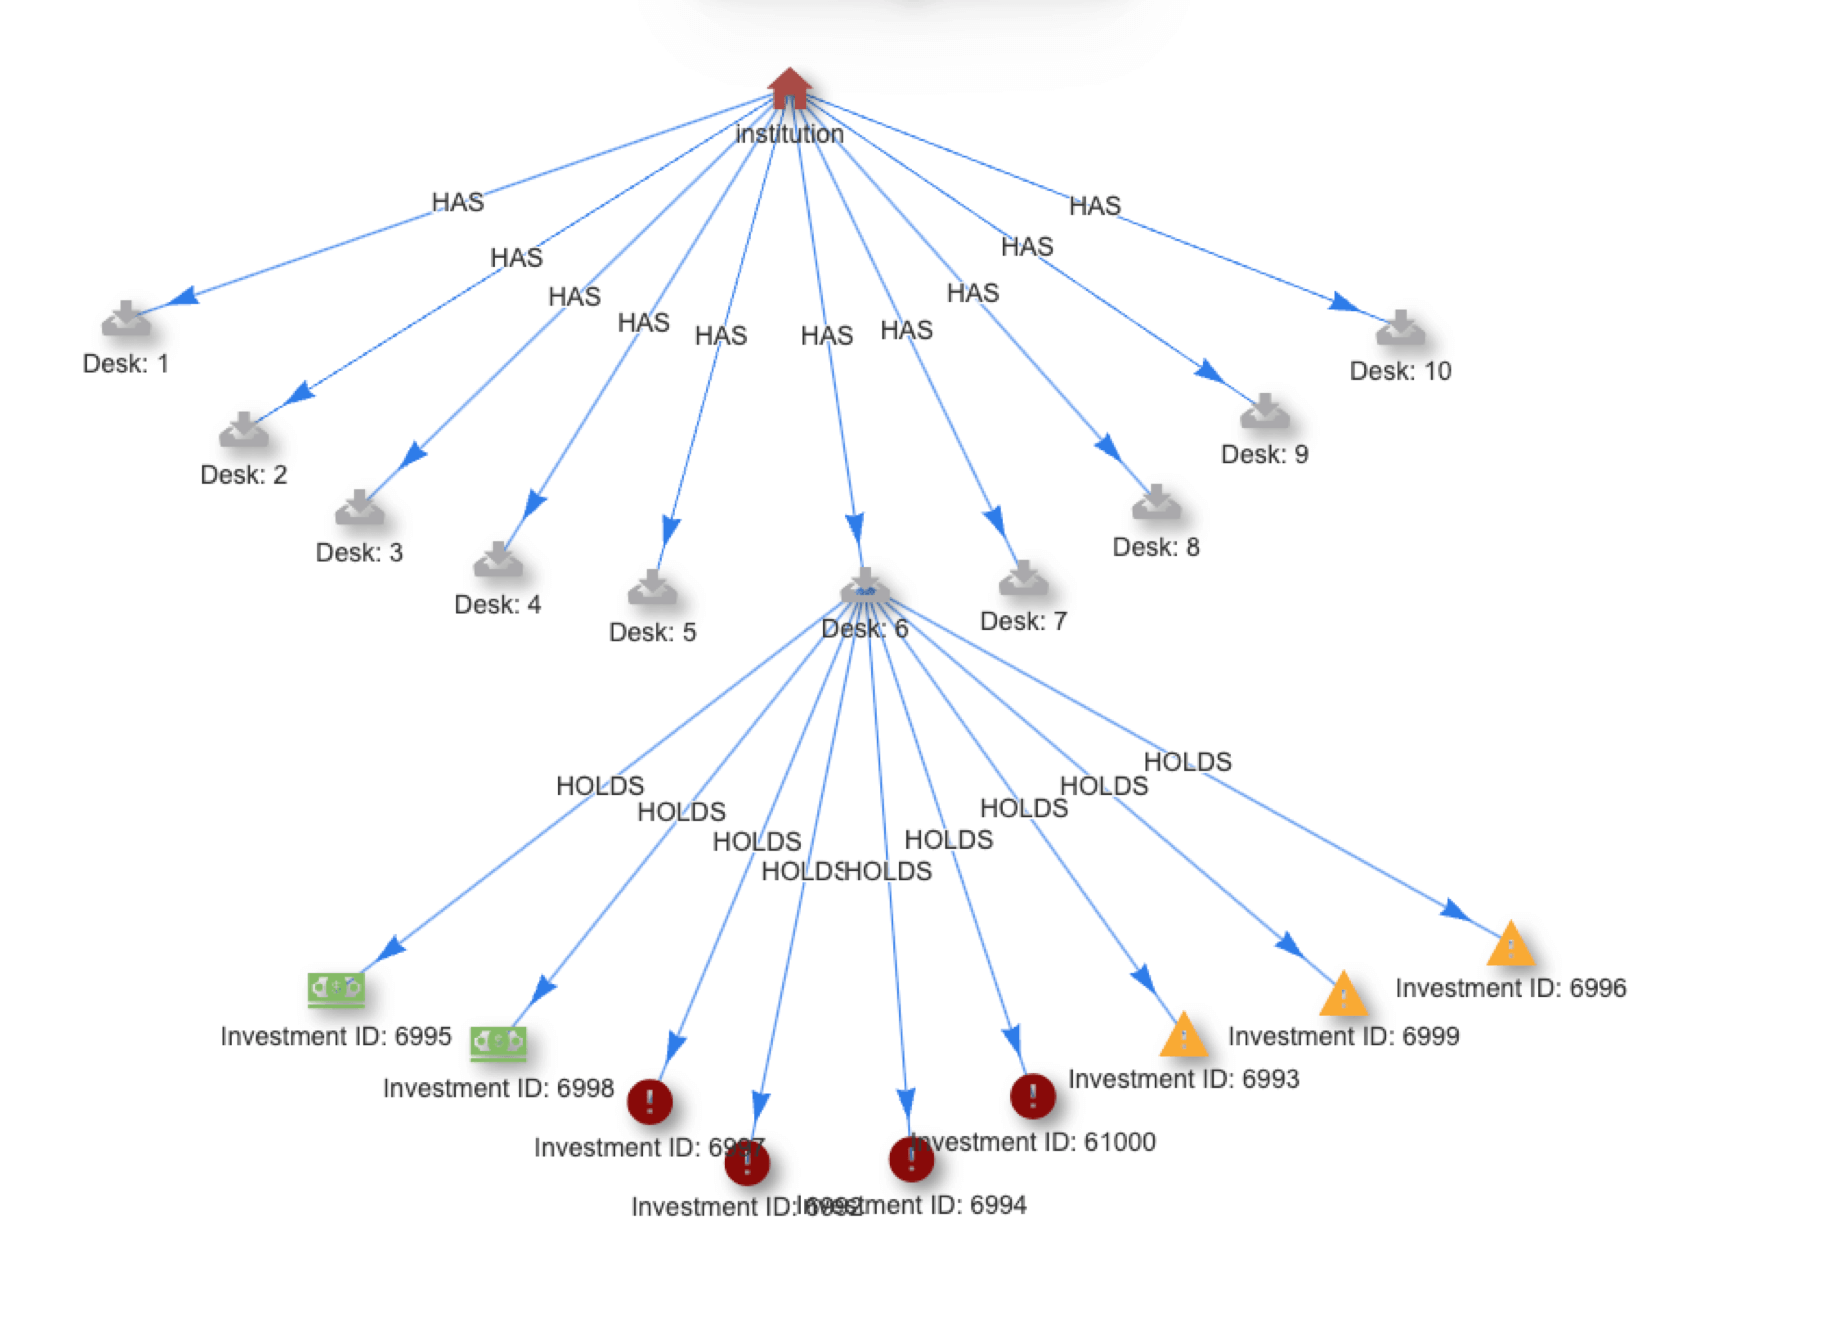
Calculate Risk and Optimize Asset Allocation in Real Time
Asset allocation and risk calculations need to move from batch to real time to free assets and improve compliance. Quine Streaming Graph provides a path.

Create a Quine Icon Library with Python
Add some flair to your Quine streaming graph visualizations while learning about the API at the same time.

Dynamic Duo: Quine & Novelty Detector for Insider Threats
In a big update to the VAST Advanced Persistent Threat blog, we demonstrate an end-to-end Quine plus Novelty Detector workflow.

idFrom(): the simple function that’s key to Quine streaming graph
idFrom() seems like a simple function for generating node IDs but it is the key to Quine’s ability to find complex patterns in high volume event streams.

Using Indicators of Behavior (IoB) Analysis for IoT data
Indicator of Behavior (IoB) analysis is extending beyond the cybersecurity domain to offer new value for finance, ecommerce, and especially IoT use cases.

Quine’s Real-time Temporal Event Sequencing Produces New Insights
Quine’s standing queries, idFrom + deterministic labelling can be use to efficiently create any subgraph you need (e.g. sequence based) in real time. This makes alerts more timely and root cause analysis more efficient.

Graph Neural Networks for Quine
Quine 1.5 includes support for graph neural network techniques like Node2Vec and GraphSAGE. This post provides an overview and tutorial.

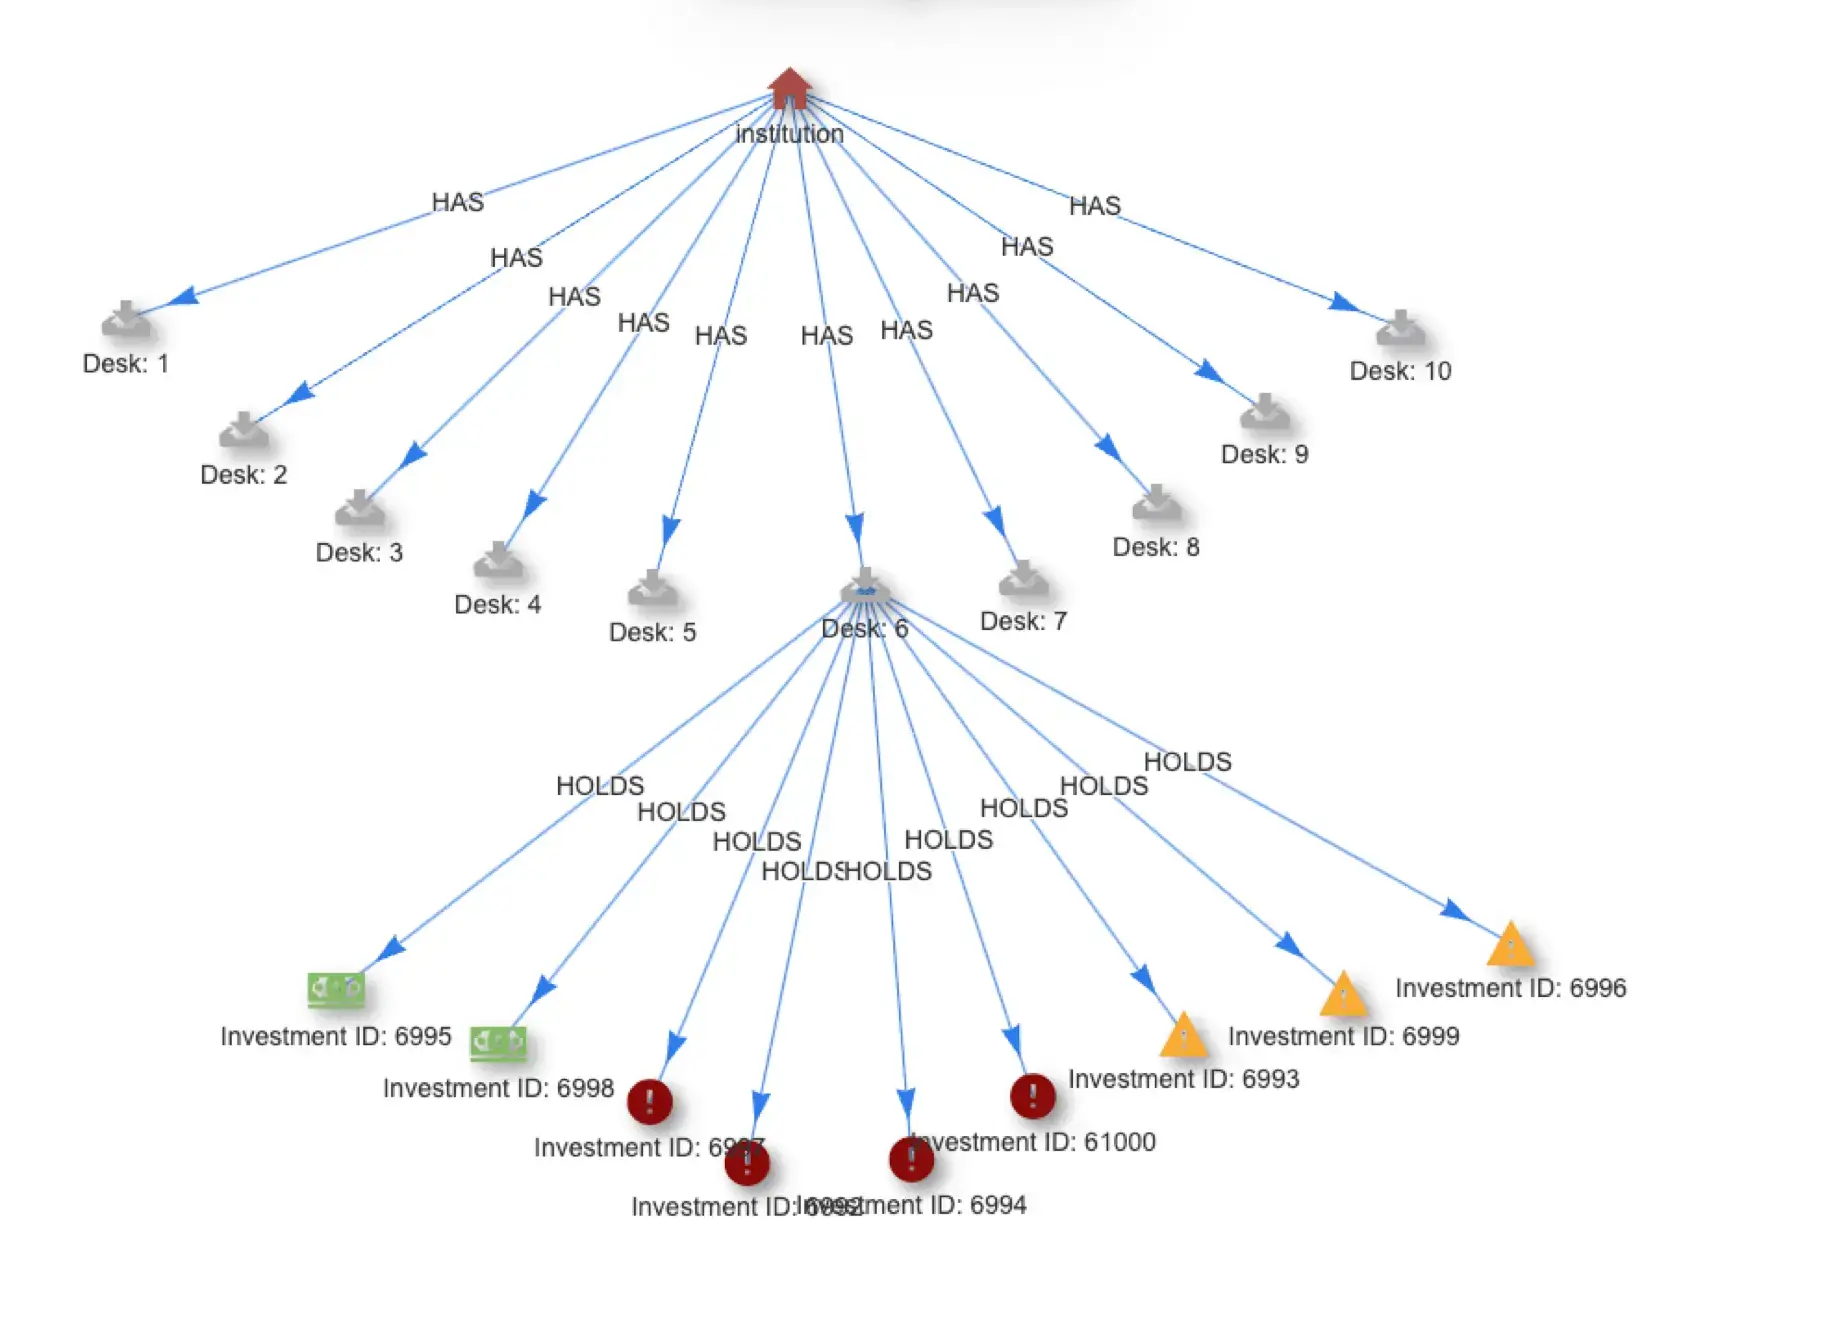
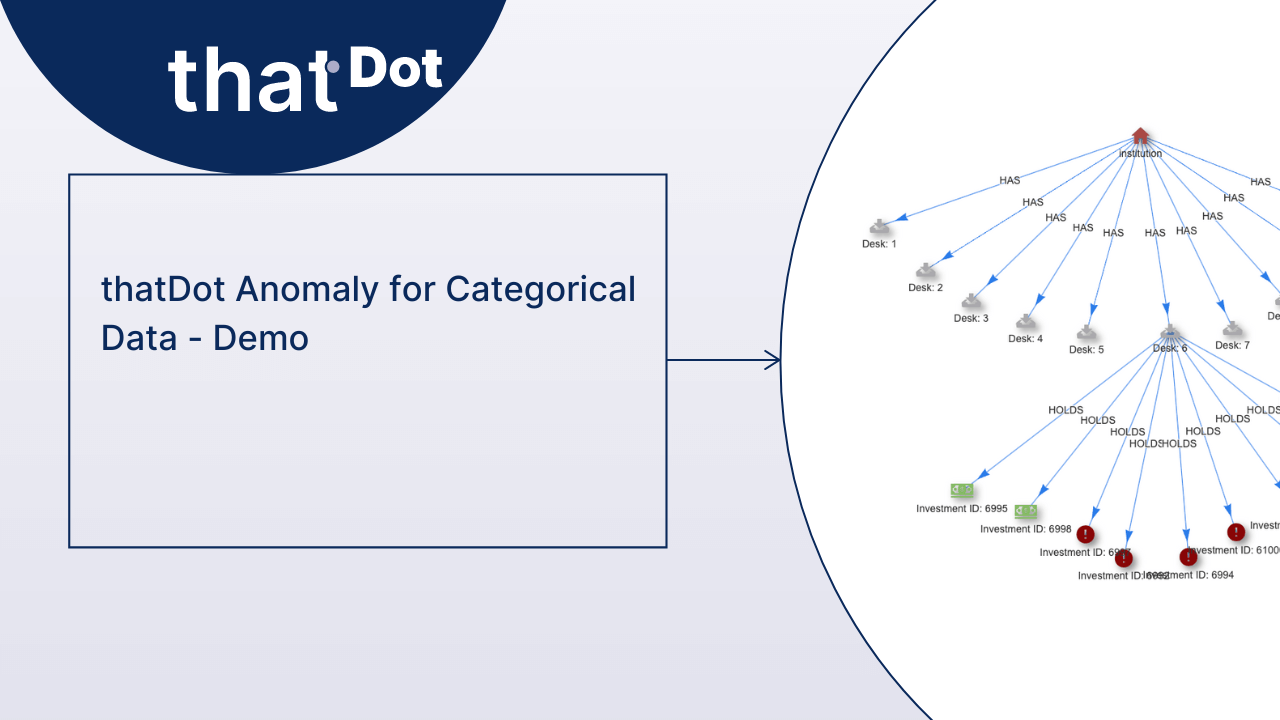
Categorical Data: An Untapped Source of Real-Time Insights
Categorical data is an oft-ignored source of valuable business intelligence. Quine makes it easy to process categorical data with your existing ETL pipeline.