A New Kind of Database: Using Graph Models to Unlock Categorical Data
Graph databases and models have been around for well over a decade, and are among the most impactful technologies to emerge from the NoSQL movement.
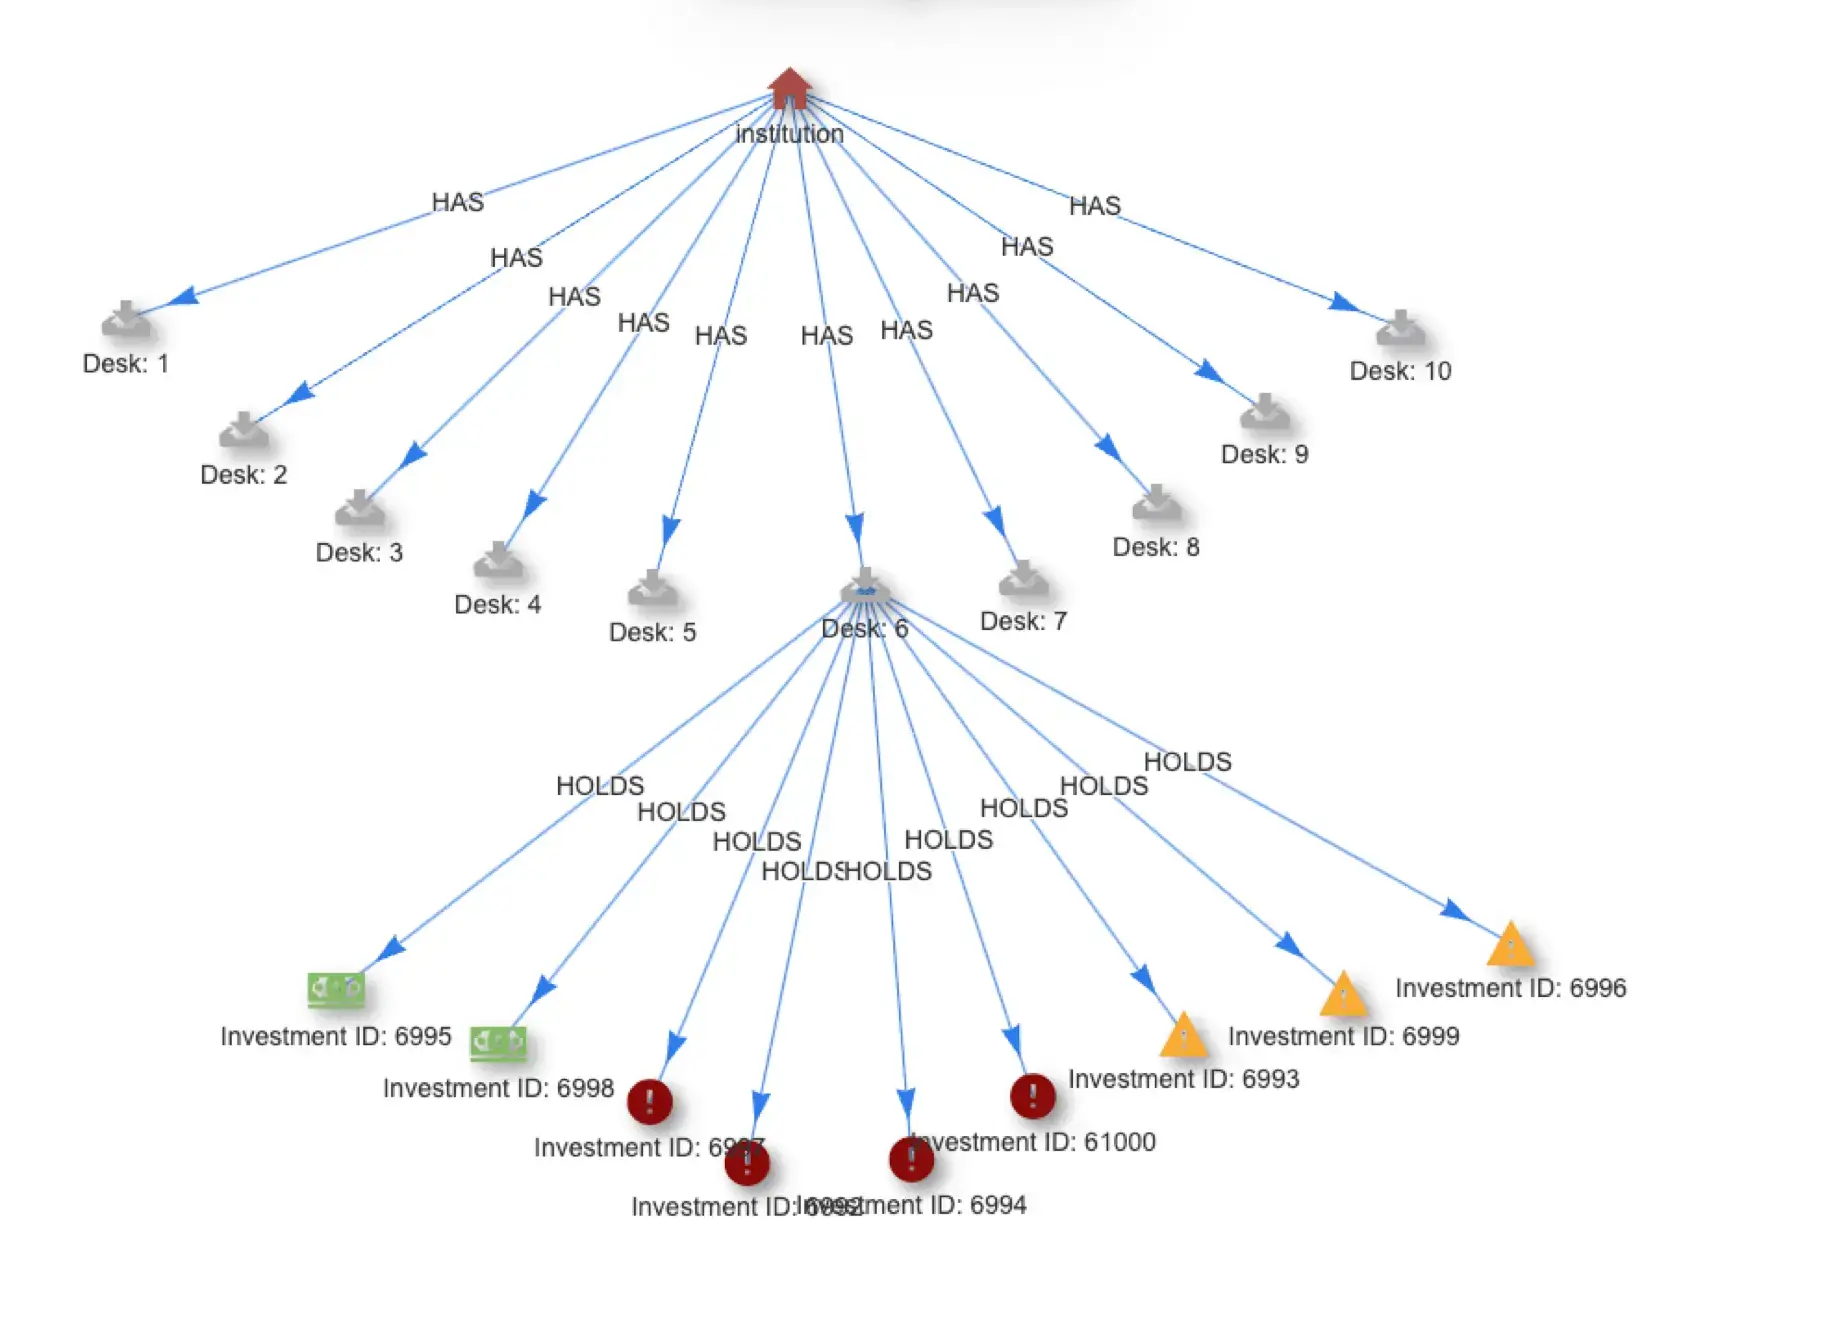
Graph data models are natively designed to focus on the relationships within and between data representing this data as nodes connected by edges. As such, the graph model is strikingly similar to the way humans often think and talk.
The node-edge-node pattern in a graph corresponds directly to the subject-predicate-object pattern common to languages like English. So, if you’ve ever used mind-mapping technology or diagrammed ideas on a whiteboard, you’ve created a graph.
A critical advantage of graph databases is their ability to express relationships between categorical data (any non-numerical value e.g. email addresses, colors, models of cars, or geographic locations). This is not possible otherwise without using encoding methods that destroy much of the value of this data, and explains why most categorical data (and 73% of all data) is simply ignored by enterprises.

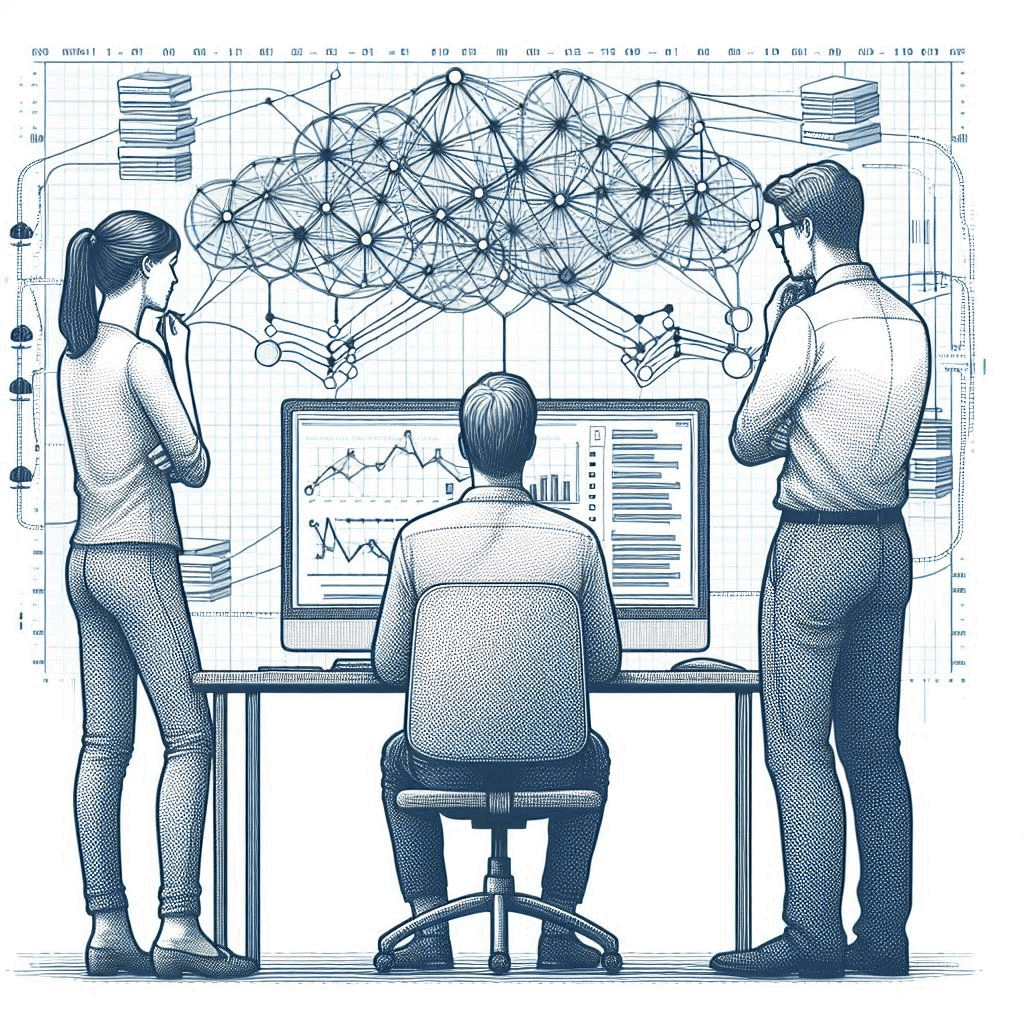
Graph databases allow you to explore the relationships between data types.
Graph data models have become part of the standard toolkit for data scientists applying artificial intelligence (AI) to everything from fraud detection and manufacturing control systems to recommendation engines and customer 360s.
Given this broad applicability, it’s no surprise Gartner believes that graph database technologies will be used in more than 80% of data and analytics innovations, including real-time event streaming, by 2025. But as adoption accelerates, limitations and challenges are emerging. And one of the most significant limitations graph databases face is their inability to scale.
Volume and Velocity of Modern Data Generation
Much has changed since the emergence of the most recent generation of graph databases from a decade ago. Enterprises are dealing with previously unimaginable volumes of data to potentially query. That data enters and streams through the enterprise in a variety of channels, and enterprises want action on that information in real time.
Original graph designs couldn’t have imagined today’s sheer volume of data or the computation power needed to put that data to work. And it’s not just the volume of data dragging graph databases down. It’s the velocity of that data.

Graph databases are great at allowing you to make connections, but they don’t scale.
While graph databases can excel at computation on moderately-sized sets of data at rest, they get especially siloed and suffer significant tradeoffs when real-time actions on streaming data are desired. Streaming is actively moving data; it constantly arrives from diverse sources.
And enterprises want to act upon it immediately in event-processing pipelines because when certain events are not caught quickly, as they happen, the opportunity to act disappears. For example, security incidents, transaction processing (such as fraud or credit validations), and automated machine-to-machine actions.
Anomalies and patterns need to be recognized with AI and ML algorithms that can automate (or at least escalate) an action. And that recognition needs to occur before an automated action can proceed.
Graph databases were simply never built for this scenario. They are typically restricted to hundreds or thousands of events per second. But today’s enterprises need to be able to process a velocity of millions of events per second and, in some advanced use cases, tens of millions.
There’s a hard limit both on how quickly graph systems can process data and on how much complexity (like how many hops in the query) they can handle. Because of those limits, graph systems often don’t get used. Since graph systems don’t get used, data engineering teams have no option other than to recreate the graph database-like functionality spread throughout their microservices architecture.
The Rise of Custom Data Pipeline Development
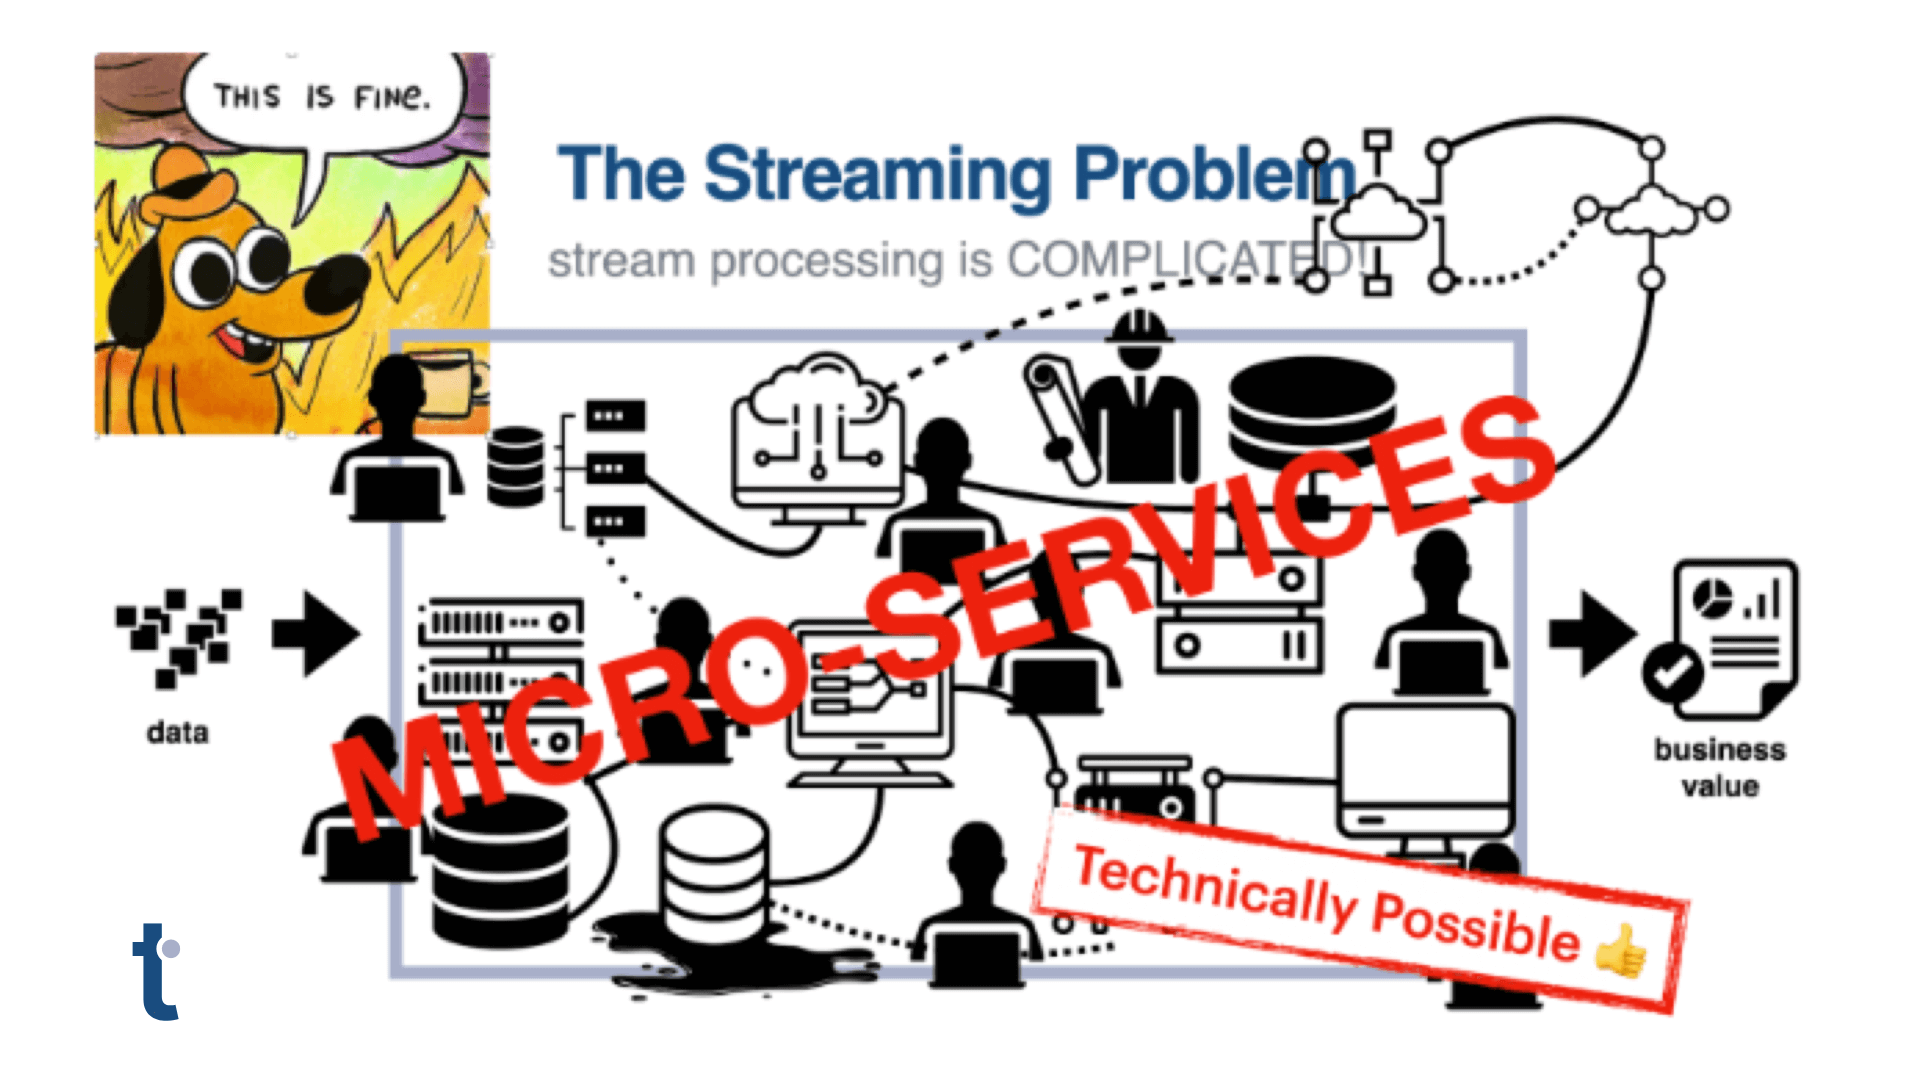
These workarounds to query the event streams in real time require significant effort. Developers typically turn to event stream processing systems like Flink and ksqlDB, which make it possible, but not easy, to use familiar SQL query syntax to query the event streams.
It’s not uncommon for enterprises to have teams of data engineers developing extensive and complex micro service architectures for months or years to get up to the scale and speed needs of streaming data. However, these systems tend to lack the expressive query structures needed to find complex patterns in streams efficiently.

Event stream processing systems like Apache Kafka and Kinesis created a new, event-driven architecture.
As noted, to operate at the volume and velocity that enterprises require, these systems have had to make tough tradeoffs that lead to significant limitations.
For example, time windows can restrict a system’s ability to connect events that do not arrive within a narrow time interval (often measured in seconds or minutes). This means that rather than providing some critical insight or business value, an event is instead simply ignored if it arrives even seconds too late.
Even with costly limitations like time windows, event stream processing systems have been successful. Many can even scale to process millions of events per second—but with significant effort and limitations that fail to deliver the full power of graph data models.
Quine Streaming Graph Was Created to Meet Demand
The demand for insights from instant event data streams and the value they deliver has never been higher. As adoption accelerates, businesses should expect to see new data infrastructure emerge to eliminate many of the scale struggles that can hold back the power of graph database models. That’s why we created Quine streaming graph. Quine solves the problem of scalable graph databases that can process millions of events per second.
Quine’s unique approach combines graph data and streaming technologies into a modern, developer-friendly open source software package. For the first time, teams can process categorical data in real time without resorting to encoding methods.
Developers and data pipeline engineers use Quine to rapidly build high volume, real-time, complex event processing workflows at scale, especially if they are using Kafka or Kinesis. A handful of Quine queries can replace months of development time and millions in costs, eliminating batch processing, multi-level joins, time windows, and other time-consuming and outdated processes that drag down and stall analysis on streaming data.
Next Steps
And if you want to try Quine yourself, you can download it here. To get started, try the Ethereum Blockchain Fraud Detection, Wikipedia Ingest or Apache Log Analytics recipes for different use cases for streaming graph.
If you have questions or want to check out the community, join Quine slack or visit our Github page.
Note: A version of this post was previously published in eWeek on May 26th, 2022.
Photo Credits:
Header image: by JJ Ying on Unsplash
Photo 1: by Alina Grubnyak on Unsplash
Photo 2: by John Barkiple on Unsplash
Photo 3: by israel palacio on Unsplash
thatDot appreciates the work of these artists and the fact they’ve made their excellent work available for use.