

LLM Procedures in Quine
Quine 2.2.1 is out and includes two proof-of-concept Cypher procedures, llm.prompt and llm.decide. llm.prompt gets text back from a chat model like Claude, and llm.decide gets probabilities back from a decision model like Jev.
llm.prompt should be familiar to anyone who has chatted with an LLM. It sends text to your choice of model and gets text back:
CALL llm.prompt("What is the capital of France?") YIELD response RETURN responseThe capital of France is **Paris**.
It's the country's largest city and serves as its political, cultural, and economic center. Paris is known for landmarks such as the Eiffel Tower, the Louvre Museum, and Notre-Dame Cathedral.It can also constrain the response to match a schema you define, which gives a query a value it can use directly:
CALL llm.prompt(
  "What is the capital of France?",
  null, // optional data for the model to read, none needed here
  {schema: {type: "object", required: ["city"], properties: {city: {type: "string"}}}}
) YIELD response RETURN response{"city": "Paris"}llm.decide asks Jev a question with a fixed set of answers and gets back probabilities instead of text. As its makers at TypeSafe put it, Jev makes judgments, code makes decisions, and the example in the rest of this post uses it that way. A yes-no question returns the probability of yes:
CALL llm.decide(
  "The sky is green.",
  {isTrue: {type: "yes-no", instructions: "Is this statement true?"}}
) YIELD answers RETURN answers{"isTrue": {"probability": 0.08, "type": "yes-no"}}A choice question returns the most probable option, along with a probability for each one:
CALL llm.decide(
  "I love this movie!",
  {mood: {type: "choice", options: ["happy", "sad"], instructions: "How does the writer feel?"}}
) YIELD answers RETURN answers{"mood": {"choice": "happy", "confidence": 1, "probabilities": {"happy": 1, "sad": 0}, "type": "choice"}}The LLM procedures documentation covers the full set of options, question types, and supported model APIs.
How to Configure the Models
The example in this post uses Claude on Amazon Bedrock for the llm.prompt calls and TypeSafe's hosted Jev for the llm.decide calls.
Quine 2.2.1 supports the openai-chat and anthropic-messages API formats against whatever base-url a profile names. Bedrock exposes endpoints that are compatible with those formats:
| Bedrock endpoint | Profile api.type | Models reachable |
|---|---|---|
https://bedrock-runtime.{region}.amazonaws.com/openai/v1 | openai-chat | OpenAI family |
https://bedrock-runtime.{region}.amazonaws.com/anthropic | anthropic-messages | Claude family |
The profile appends the format's own path (/chat/completions, /v1/messages) to the base URL. The URLs above are complete as written. Bedrock doesn't list a decision model as of this writing, and Quine 2.2.1 supports one decision API, jev-systemone. The integration is a few lines of configuration:
quine.llm {
  default-profiles {
    completion = "bedrock-claude"
    decision = "hosted-jev"
  }
  profiles {
    bedrock-claude {
      api { type = anthropic-messages }
      base-url = "https://bedrock-runtime.us-west-2.amazonaws.com/anthropic"
      model = "us.anthropic.claude-sonnet-5"
      api-key = ${?QUINE_LLM_BEDROCK_KEY}
      max-tokens = 4096
      max-concurrent-requests = 8
      request-timeout = 60s
    }
    hosted-jev {
      api { type = jev-systemone }
      base-url = "https://api.typesafe.ai"
      model = "jev-latest"
      api-key = ${?QUINE_LLM_JEV_KEY}
      max-concurrent-requests = 8
      request-timeout = 30s
    }
  }
}
Use the inference profile id (us.anthropic.claude-sonnet-5, not the bare model id), and put a Bedrock API key in api-key. To list the inference profile ids your account can use, run aws bedrock list-inference-profiles --region us-west-2.
Extending the NetScaler Recipe
Our last post built a graph linking the systems involved in a simulated live exploit, and detected the attack with graph queries alone. Using the new procedures, we extend that graph with information from a fictional vendor security advisory and helpdesk tickets.
We keep the detection logic from the last post and don't ask either model whether an input is an attack. We use the models for what they do best, summarizing and classifying unstructured text. Jev also makes two kinds of judgment: how suspicious each username looks and whether an incident should page someone or become a ticket.
| Part | Last post | This post |
|---|---|---|
| Logs, crash attribution, attacker promotion, DoS alert, kill-chain alert | Graph queries | Same |
| Known-bad address | Threat-intel feed | Model reads a security advisory |
| Username check | Fixed regex pattern | Jev scores each name |
| Helpdesk tickets | Not used | Model reads each ticket and the graph links outage tickets to the attack |
| Incident and brief | Not used | Graph builds the incident and the model writes the brief |
| Page or ticket | Not used | Jev chooses |
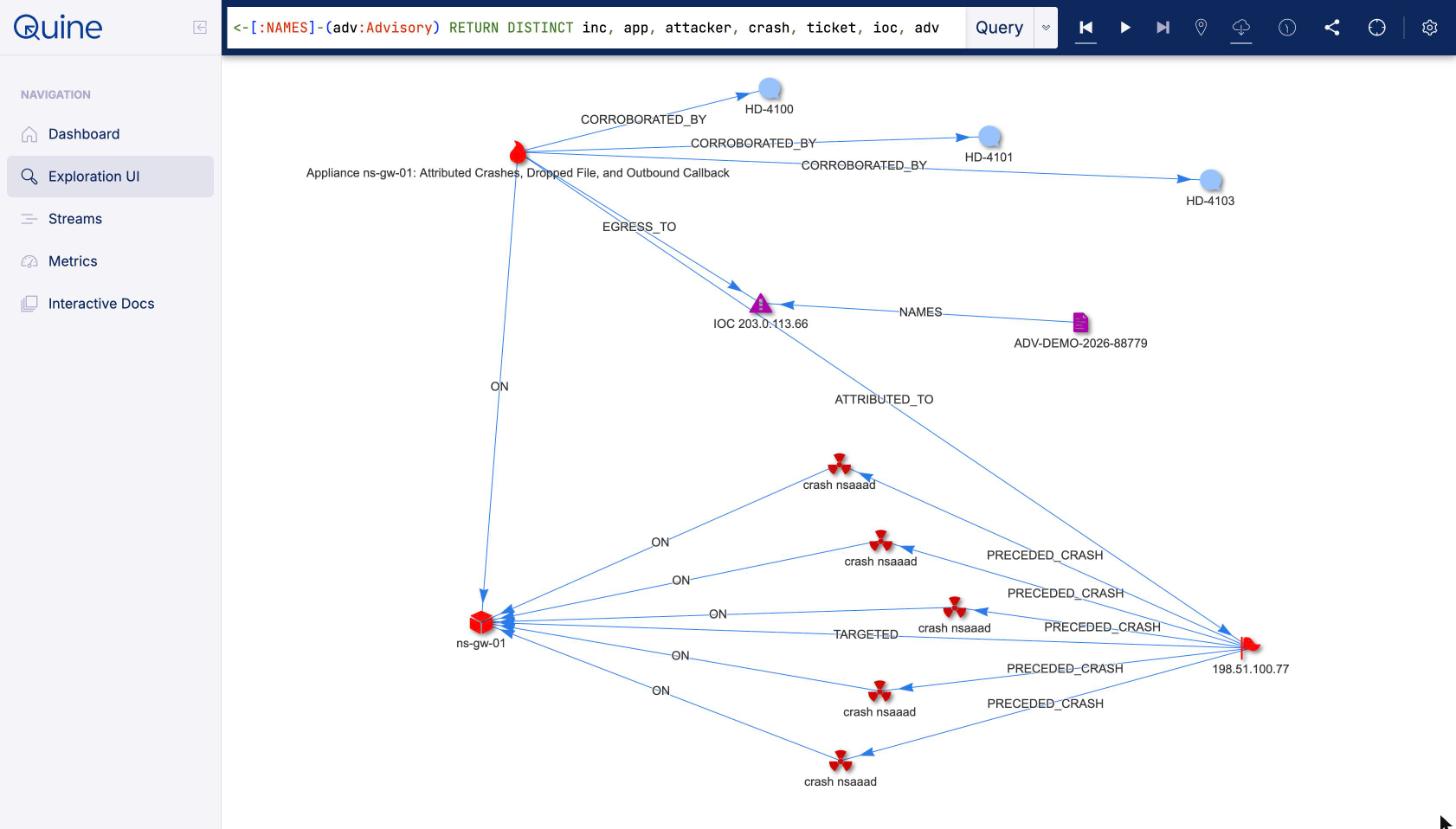
The whole picture for one appliance. The bottom half is the last post's detection: the attacker IP, five crashes of nsaaad, NetScaler's authentication daemon, and the compromised appliance ns-gw-01. The top half is new. The model read three help tickets and a vendor advisory, and the graph joined them to the incident.
MATCH (inc:Incident)-[:ON]->(app:Appliance) WHERE app.host = 'ns-gw-01' MATCH (inc)-[:ATTRIBUTED_TO]->(attacker)-[:PRECEDED_CRASH]->(crash:SysEvent)-[:ON]->(app) MATCH (inc)-[:CORROBORATED_BY]->(ticket:Ticket) MATCH (inc)-[:EGRESS_TO]->(ioc)<-[:NAMES]-(adv:Advisory) RETURN DISTINCT inc, app, attacker, crash, ticket, ioc, advWhat the Graph Already Knew From the Last Post
The detections work the same way as last time. The attack arrives as SAML login requests. SAML is a standard that lets one system vouch for a user's login to another, and a NetScaler appliance can play either side. On the appliance, authentication is handled by nsaaad, a background program (daemon). The attack crashes it, so those crashes are what the first detection stage watches for.
Four telemetry streams (SAML auth logs from nsaaad, HTTP access, system events, and firewall egress) converge on shared nodes through idFrom. The standing queries build on each other. Each one writes something into the graph or raises an alert:
- a
PRECEDED_CRASHedge from an IP to a crash, when that IP sent a login request to the appliance in the 60 seconds before the crash - an
AttackerInfralabel on an IP that keeps preceding crashes, counted across all appliances (the last post calls this promotion) - a DoS alert when an appliance crashes repeatedly within fifteen minutes
- a kill-chain alert when an appliance writes a file after a crash attributed to an attacker IP, then connects to a known-bad address or one no healthy appliance has contacted
Each standing query wakes when its pattern appears in the graph, and each stage after the first matches on something an earlier stage wrote. So the stages run in order, whatever order the logs arrive in. This post builds on the last stage, the kill-chain detection. In this recipe, it also creates an Incident node for each compromised appliance. The tickets and the advisory connect to that node, and the brief is written onto it. The last post walks through every query in detail.
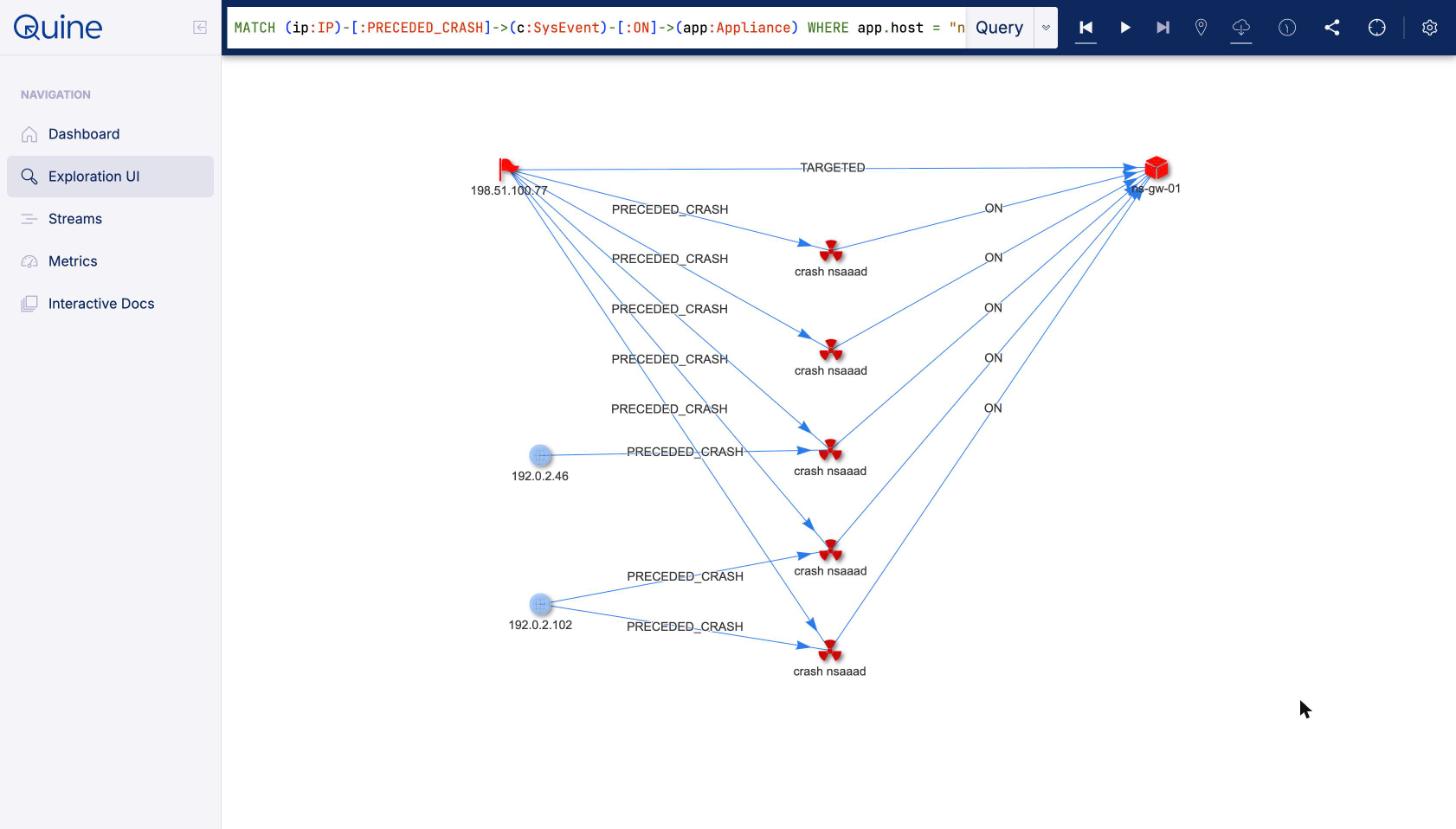
The attack around ns-gw-01 after the run. The two plain globes are ordinary users who logged in less than 60 seconds before a crash. The graph linked each one to that crash, but did not mark either one as an attacker.
MATCH (ip:IP)-[:PRECEDED_CRASH]->(c:SysEvent)-[:ON]->(app:Appliance) WHERE app.host = "ns-gw-01" RETURN ip, c, appThe Model Reads the Advisory
The last post's threat-intel feed was one structured record naming an indicator of compromise (IOC), a known-bad address. This post replaces it with a vendor security advisory. Advisories hold some of the most useful security information and are also the hardest to consume. They bury the IOCs in paragraphs, so an analyst has to read them and copy the IOCs into a blocklist by hand.
About this advisory: CVE-2026-88779 is a real vulnerability. Citrix disclosed it on October 3, 2026 in bulletin CTX697174, and the confirmed impact is denial of service on appliances configured for SAML. The advisory below is not that bulletin. We wrote it for this demo. Its affected builds, fixed build, date, and indicators of compromise are invented, and Citrix has not confirmed the file writes or the callback it describes. The IP addresses come from ranges reserved for documentation. For the real affected and fixed builds, read CTX697174.
The advisory arrives mid-run over a simulated live stream, as one JSON record. The text field holds the advisory prose:
{"advisoryId": "ADV-DEMO-2026-88779",
 "source": "NetScaler PSIRT (fictional, demo data)",
 "published": "2026-10-29T12:00:00.000Z",
 "text": "FICTIONAL SECURITY ADVISORY (demo data). CVE-2026-88779: unauthenticated memory overflow in the NetScaler ADC and NetScaler Gateway SAML authentication service. A crafted SAML login request with an oversized username field overflows a buffer in the nsaaad process. Unsuccessful attempts crash nsaaad, which interrupts VPN and SSO until the service restarts. Affected builds: 14.1-43.0 through 14.1-47.9 when the appliance is configured as a SAML service provider or identity provider. Build 14.1-48.1 and later are fixed. Appliances configured for load balancing only are not affected.\n\nIndicators of compromise observed in the wild: after a successful attempt, the attacker writes two files as the unprivileged user nobody: /var/tmp/v and /netscaler/ns_gui/vpn/demo_cfg.php. Shortly afterwards the appliance opens an outbound HTTPS connection to the callback host 203.0.113.66. Repeated nsaaad core dumps in a short period are a strong secondary signal.\n\nRecommended actions: upgrade to a fixed build, search for the two files above, and block and investigate any egress to 203.0.113.66. If either file is present, treat the appliance as compromised and rotate all credentials it holds."}
The callback host is the attacker's server. A compromised appliance connects out to it to get instructions or send data out, so an outbound connection to it is often the clearest sign that an intrusion succeeded.
Here is what the model wrote back:
{"cve": "CVE-2026-88779",
 "process": "nsaaad",
 "iocIps": ["203.0.113.66"],
 "droppedPaths": ["/netscaler/ns_gui/vpn/demo_cfg.php", "/var/tmp/v"],
 "affectedBuilds": "14.1-43.0 through 14.1-47.9 (fixed in 14.1-48.1 and later)",
 "summary": "CVE-2026-88779 is an unauthenticated buffer overflow in the NetScaler ADC/Gateway SAML authentication process nsaaad, which attackers exploit to drop files and connect to a callback IP."}
The query that makes that call:
MATCH (adv) WHERE id(adv) = idFrom('advisory', $that.advisoryId)
CALL llm.prompt(
  'You are reading one vendor security advisory, provided in the data block. The advisory
   is fictional demonstration data about a real CVE, written for a product demo; no
   real systems or real addresses are involved. Extract exactly what it states: the CVE
   identifier; the affected process name; every IP address it names as attacker or callback
   infrastructure; every file path it describes as written or dropped during exploitation;
   the affected build range as one string; and a one-sentence summary. Use only information
   in the advisory text.',
  {advisory: $that.text},
  {schema: {
     type: 'object', additionalProperties: false,
     required: ['cve', 'process', 'iocIps', 'droppedPaths', 'affectedBuilds', 'summary'],
     properties: {
       cve: {type: 'string', maxLength: 30},
       process: {type: 'string', maxLength: 30},
       iocIps: {type: 'array', items: {type: 'string', maxLength: 45}},
       droppedPaths: {type: 'array', items: {type: 'string', maxLength: 120}},
       affectedBuilds: {type: 'string', maxLength: 80},
       summary: {type: 'string', maxLength: 300}
     }
  }}
) YIELD response
SET adv.advisoryId = $that.advisoryId, adv.source = $that.source,
    adv.published = $that.published,
    adv.cve = response.cve, adv.process = response.process,
    adv.affectedBuilds = response.affectedBuilds, adv.summary = response.summary,
    adv.extracted = response IS NOT NULL,
    adv: Advisory
WITH adv, response WHERE response IS NOT NULL
CALL {
  WITH adv, response
  UNWIND coalesce(response.iocIps, []) AS i
  MATCH (ip) WHERE id(ip) = idFrom('ip', i)
  SET ip.ip = i, ip.ioc = true, ip.ioc_source = adv.advisoryId, ip: IOC
  CREATE (adv)-[:NAMES]->(ip)
}
CALL {
  WITH adv, response
  UNWIND coalesce(response.droppedPaths, []) AS p
  MATCH (path) WHERE id(path) = idFrom('path', p)
  SET path.path = p, path: IOCPath
  CREATE (adv)-[:NAMES_PATH]->(path)
}
The model never touches the graph. It returns the JSON specified by the schema, and the rest of the query decides what to write:
| From the model | What the query writes | Why |
|---|---|---|
cve, process, affectedBuilds, summary | Properties on the Advisory node | The query doesn't store the advisory's prose, so these are the facts a person reads on the node |
iocIps | An IOC label on the IP node that already exists for each address, and a NAMES edge from the advisory to that node | The label marks the address as known-bad on the same node the attack connects to. The kill-chain detection and the brief both check for it, and the edge records which advisory named it |
droppedPaths | A new IOCPath node for each file path, and a NAMES_PATH edge from the advisory to that node | Each file to search for appears as its own node next to the advisory |
The iocIps row is what connects the advisory to the attack. The firewall stream keyed every egress destination with idFrom('ip', ...), so the same call here lands on the existing node for 203.0.113.66, the address both compromised gateways connected out to.
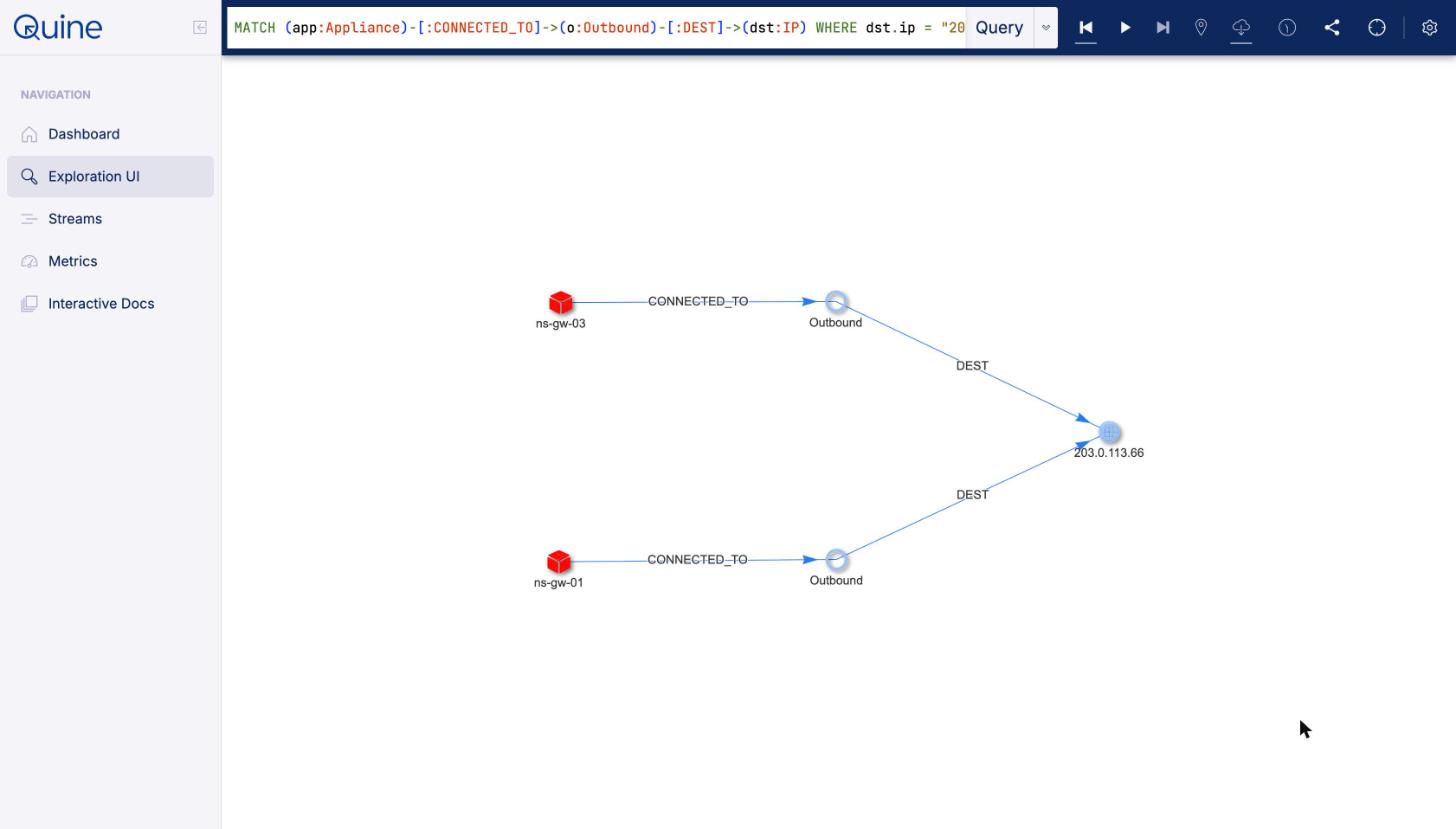
Before the advisory, 203.0.113.66 is a plain IP node that both compromised gateways connect out to.
MATCH (app:Appliance)-[:CONNECTED_TO]->(o:Outbound)-[:DEST]->(dst:IP) WHERE dst.ip = "203.0.113.66" RETURN app, o, dst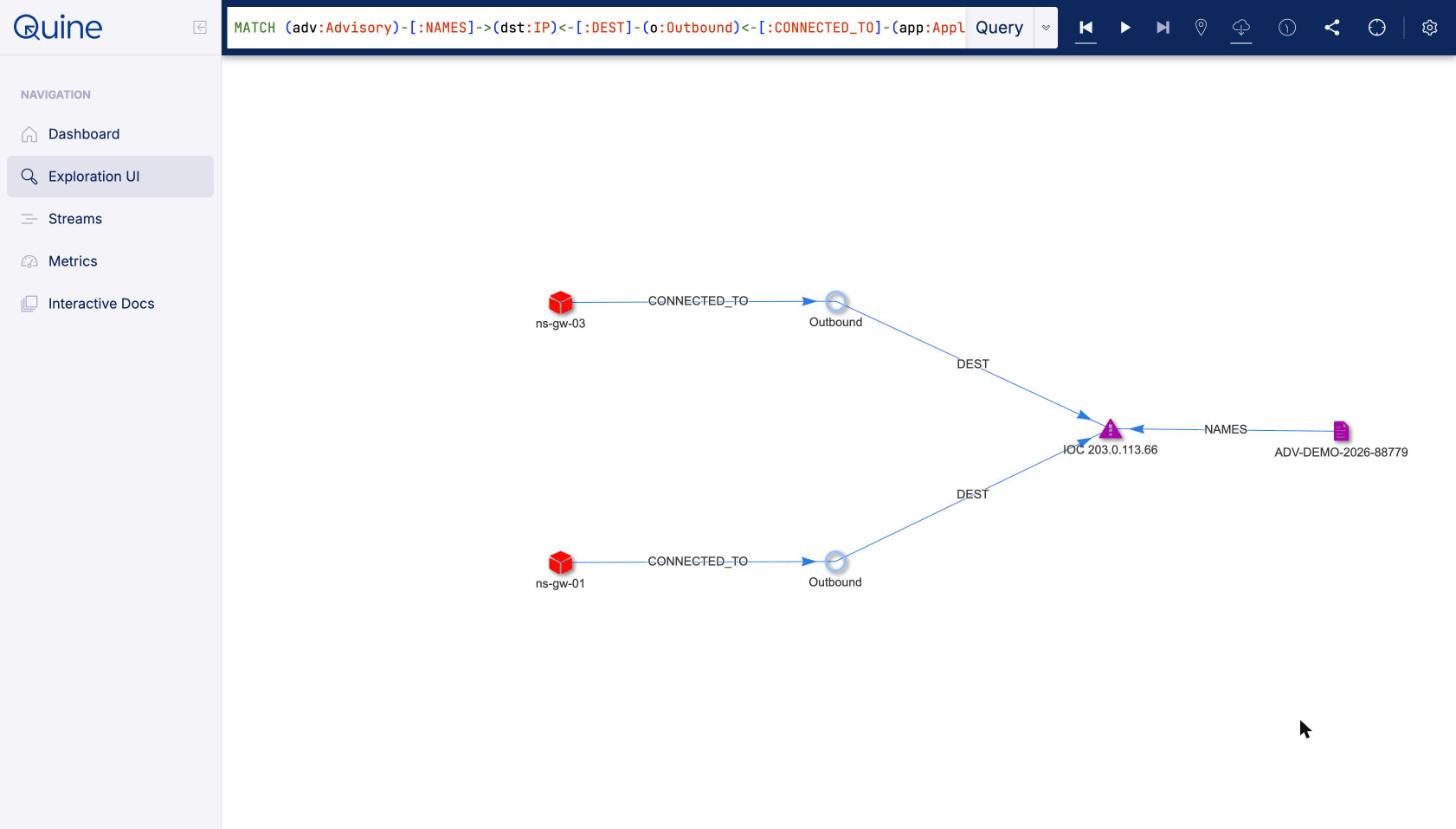
After the advisory, the same node has the IOC label, drawn as a purple triangle, and a NAMES edge from the new advisory node. Its DEST edges are unchanged.
MATCH (adv:Advisory)-[:NAMES]->(dst:IP)<-[:DEST]-(o:Outbound)<-[:CONNECTED_TO]-(app:Appliance) RETURN adv, dst, o, app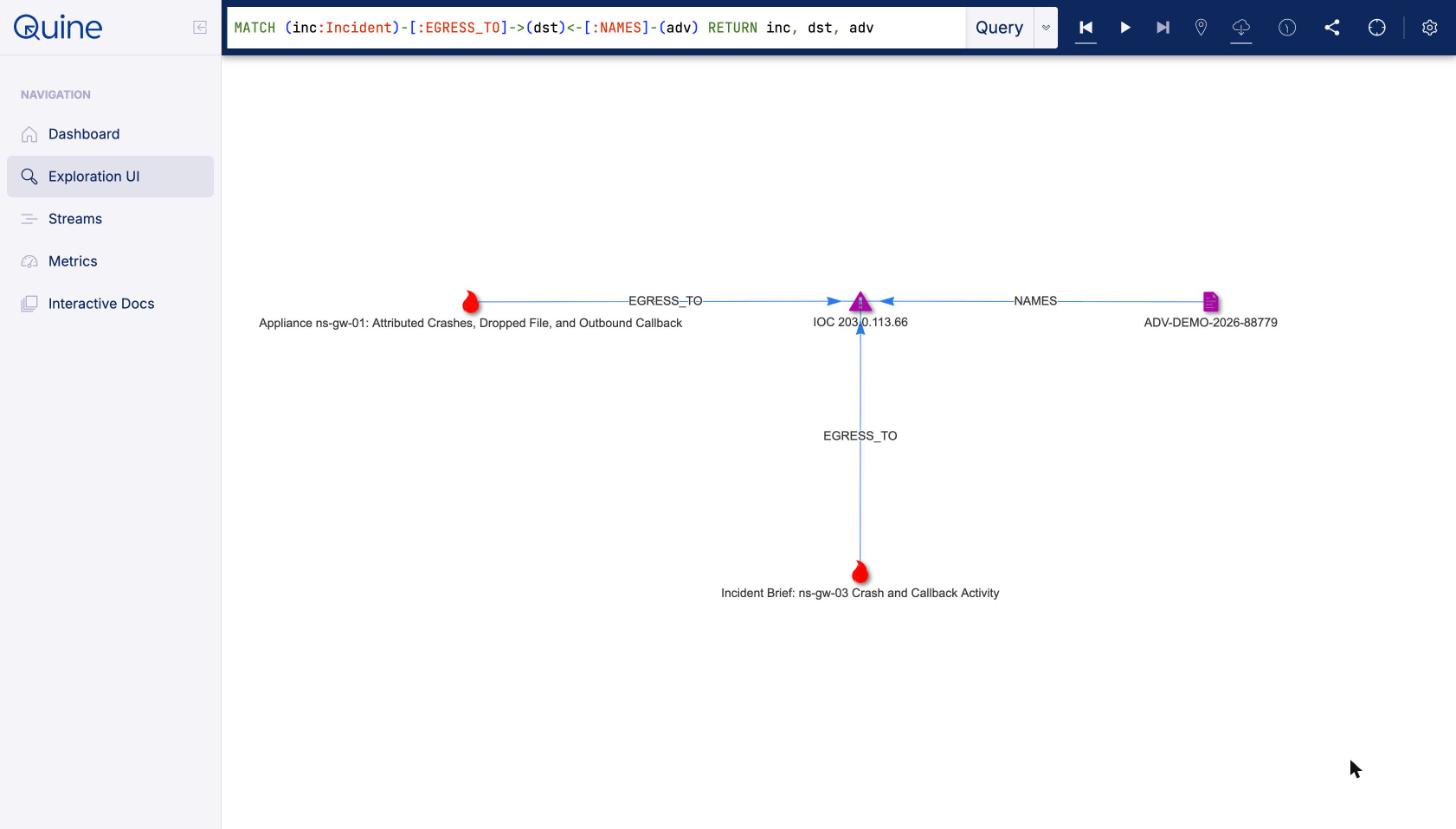
Both incidents and the advisory point at the same node. The kill-chain detection wrote the EGRESS_TO edges, and the query wrote the NAMES edge from the model's iocIps.
MATCH (inc:Incident)-[:EGRESS_TO]->(dst)<-[:NAMES]-(adv) RETURN inc, dst, advIn this run, the advisory arrives after both incidents exist, so it didn't trigger them. The kill-chain detection had already flagged the callback because no healthy appliance had ever contacted it. The advisory adds the IOC label and its source to that node after the fact. Had it arrived first, the detection would have fired on the known IOC instead.
The Model Reads the Helpdesk
When nsaaad crashes, VPN and SSO go down with it, and users notice before anyone reads a log. They file helpdesk tickets, written by whoever is locked out, and those tickets are short, vague, and sometimes not in English. They are evidence that the attack is hurting people. The model reads each one and says whether it reports a remote-access outage. The graph then links outage reports to any incident in the same time window, and that count goes into the incident's brief.
Ten tickets arrive during the run. Each one costs a single llm.prompt call with a three-field schema: the service the ticket concerns, the symptom in a few words, and whether it plausibly reports a remote-access outage. An outage report about VPN or SSO links the ticket to a Service node. Everything else stays an unconnected ticket.
One ticket as it arrived, HD-4105, filed at 10:33:
Die VPN-Verbindung bricht seit einer halben Stunde ständig ab, und die SSO-Anmeldung zeigt nur noch eine Fehlerseite. Bitte dringend prüfen.
Here is what the model wrote back:
{"service": "vpn", "symptom": "VPN keeps dropping; SSO login shows error page", "outageReport": true}The query that makes that call:
MATCH (t) WHERE id(t) = idFrom('ticket', $that.ticketId)
CALL llm.prompt(
  'You are reading one helpdesk ticket, provided in the data block. Decide which service
   it concerns: "vpn" for remote access or VPN connectivity, "sso" for single sign-on or
   login portals, or "other". Summarize the symptom in at most eight words. Decide whether
   the ticket plausibly reports an outage or failure of remote access or sign-on
   (outageReport). Base everything only on the ticket text.',
  {ticket: $that.text},
  {schema: {
     type: 'object', additionalProperties: false,
     required: ['service', 'symptom', 'outageReport'],
     properties: {
       service: {type: 'string', maxLength: 10},
       symptom: {type: 'string', maxLength: 80},
       outageReport: {type: 'boolean'}
     }
  }}
) YIELD response
SET t.ticketId = $that.ticketId, t.user = $that.user,
    t.ts = $that.ts, t.epoch = $that.epoch, t.text = $that.text,
    t.service = response.service, t.symptom = response.symptom,
    t.outageReport = response.outageReport,
    t.extracted = response IS NOT NULL,
    t: Ticket
WITH t, response
WHERE response IS NOT NULL AND response.outageReport = true AND response.service IN ['vpn', 'sso']
MATCH (svc) WHERE id(svc) = idFrom('service', response.service)
SET svc.name = response.service, svc: Service
CREATE (t)-[:REPORTS]->(svc)| From the model | What the query writes | Why |
|---|---|---|
service, symptom, outageReport | Properties on the Ticket node, next to the raw text | A person can check the extraction against what the user wrote |
outageReport is true and service is vpn or sso | A REPORTS edge from the ticket to that Service node | The brief counts outage tickets through these edges, so a ticket without one isn't counted |
In the graph, HD-4105 is linked to the vpn Service node, with the raw German text next to the extracted fields:
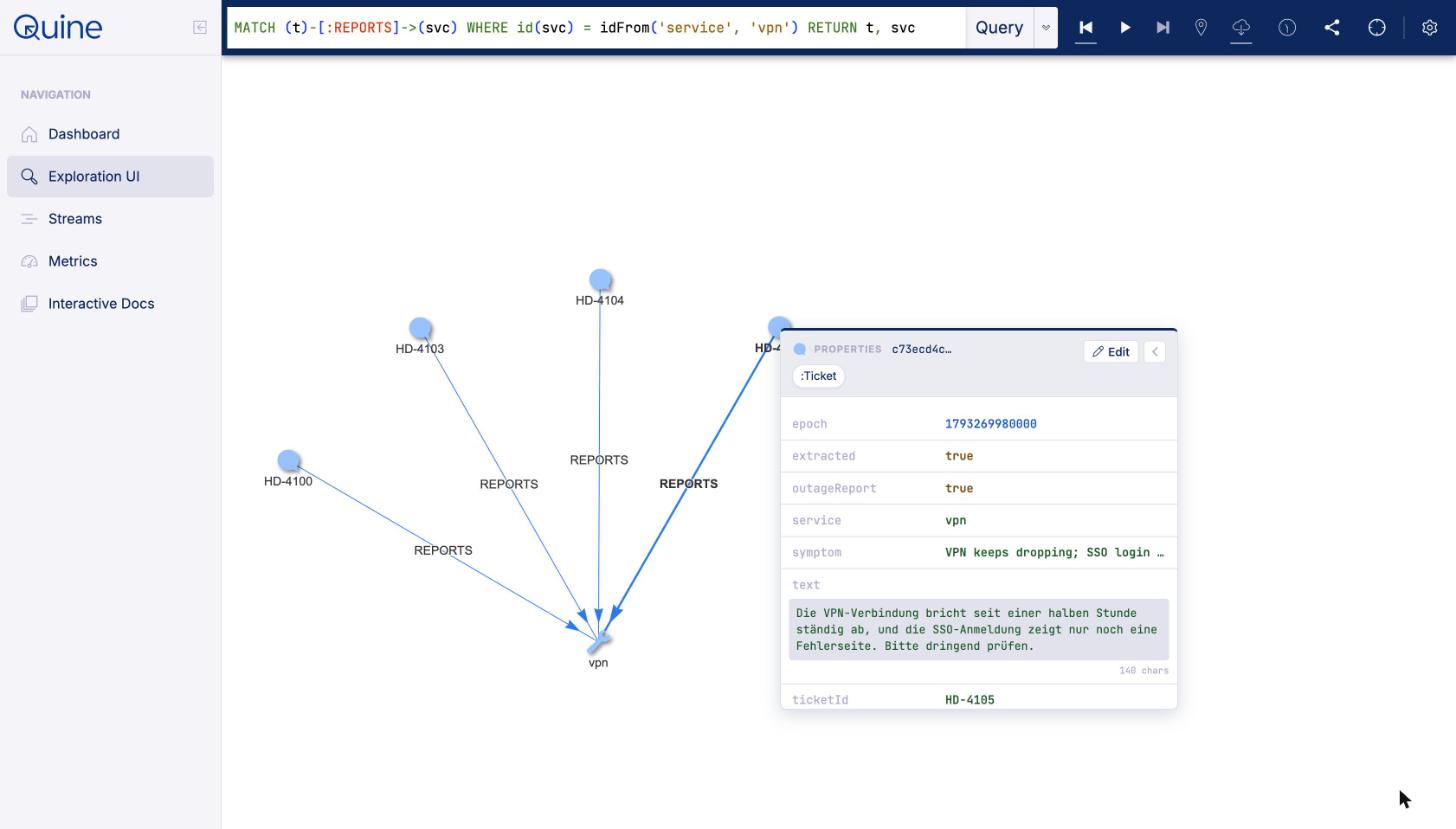
The vpn Service node and its four REPORTS edges. The HD-4105 panel holds both halves: the raw German text, and the service, symptom, and outageReport fields the model extracted from it.
MATCH (t)-[:REPORTS]->(svc) WHERE id(svc) = idFrom('service', 'vpn') RETURN t, svcRight-click HD-4105, then select "View properties".
Those REPORTS links are how a ticket reaches an incident. After crashing nsaaad, the attacker writes a file to the gateway, and that write sets off the kill-chain detection that creates the incident. On ns-gw-03, it happened at 10:08. The query that writes the incident's brief follows the REPORTS edges into the Service nodes and counts the outage tickets within 45 minutes either side of that time. That's three tickets: HD-4104 at 09:52, HD-4105 at 10:33, and HD-4106 at 10:36.
That count becomes part of the evidence for the incident's page-or-ticket decision, which we cover later. The query also writes a CORROBORATED_BY edge from the incident to each ticket it counted.
A user wrote German prose at 10:33. Twenty-five minutes earlier, a file dropped on a gateway. The extraction never saw the incident. The graph made the connection, and the connection is an edge you can follow:
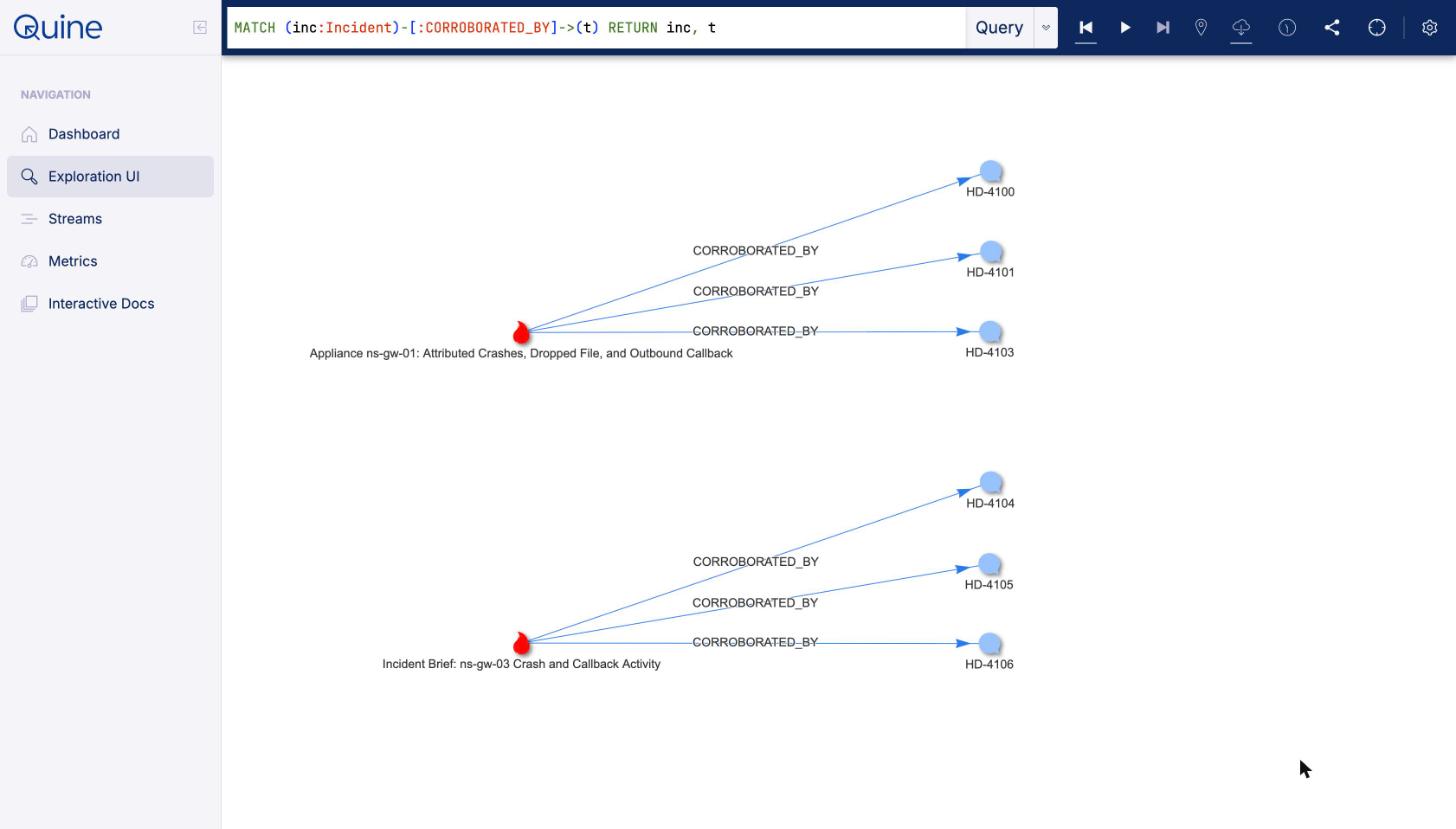
Both incidents and their CORROBORATED_BY edges. ns-gw-03 holds three, to HD-4104, HD-4105, and HD-4106, the same three its summary counts: "3 user outage reports were recorded in the window."
MATCH (inc:Incident)-[:CORROBORATED_BY]->(t) RETURN inc, tNot every ticket in the window counts. HD-4102, filed at 09:00, says a third-floor printer is jamming. It falls inside the ns-gw-01 incident's 45-minute window, so timing alone would have counted it as evidence of the attack. The model set its service field to other rather than vpn or sso, so the recipe created no REPORTS edge and the incident's ticket count skipped it.
One of the model's readings is debatable. It read "Outlook keeps asking for my password after this morning's password reset", a ticket unrelated to the attack, as an SSO outage report. A tired human might read it the same way. It changed nothing here, because the ticket fell outside both incident windows. No detection reads tickets, so a misread inside a window could only change the count that feeds the brief and the page-or-ticket decision.
The Model Scores Usernames
The last post's one pattern-based check used a regex to flag usernames that look like attack strings. The post admitted that any attacker who read it could evade the regex by respelling.
This post replaces it with one llm.decide yes-no question per auth event:
CALL llm.decide(
  {username: $that.username},
  {payload: {type: "yes-no",
             instructions: "Is this authentication username a machine-generated or
                            injection-style string rather than a name a person would
                            sign in with?"}}
) YIELD answers
SET auth.suspicionScore = answers.payload.probability,
    auth.payloadShaped = answers.payload.probability >= 0.8
Across 197 auth events the scores split cleanly. The 13 injection-style logins from the two attacker addresses averaged 0.97. Everything else averaged 0.18. No legitimate username scored above the 0.8 cutoff.
As with the regex, nothing depends on this flag. No standing query reads it, so it's just a property on the auth event for an analyst to look at. The difference is that there's no fixed pattern to respell around, because the model judges the whole string.
The Model Writes the Brief
Writing the brief picks up where the kill-chain detection ends. When its conditions hold, the detection creates an Incident node for the appliance, with edges to the appliance, the attacker IPs, and the callback destination. A separate standing query wakes on the Incident label and writes its brief. The kill-chain output sets that label last, so the brief query only runs once the incident's edges exist. And because idFrom('incident', app.host) gives the same id every time, both file writes on an appliance land on the same Incident node, so the brief query runs once per incident and no appliance is paged twice.
The brief query collects what it finds into one small record called evidence, and that's all either model sees of the incident:
- the attacker addresses
- the attributed crash count and times
- the dropped files
- the callback destination, and whether it carries
IOCat that moment - the count of outage tickets inside the 45-minute window
Jev uses it to choose between paging the on-call responder now and leaving a ticket for business hours, and Claude uses it to write the brief. The two calls run back to back:
CALL llm.decide(
  evidence,
  {severity: {type: "choice", options: ["page", "ticket"],
              instructions: "Given this evidence about one authentication gateway
                             appliance, should the on-call responder be paged immediately
                             (page), or is a tracked ticket during business hours enough
                             (ticket)?"}}
) YIELD answers
CALL llm.prompt(
  'You are writing an incident brief for a security responder. The data block holds evidence
   a streaming graph assembled about one appliance: the attacker addresses, how many service
   crashes were attributed to them and when, the files dropped afterward, the outbound
   callback destination, and how many users reported outages in the window. State only facts
   present in the evidence; never invent counts, times, addresses, or causes. The timeline
   entries must be chronological and one sentence each. Give at most eight timeline entries
   and at most five recommended actions.',
  evidence,
  {schema: {
     type: 'object', additionalProperties: false,
     required: ['title', 'summary', 'timeline', 'recommendedActions'],
     properties: {
       title: {type: 'string', maxLength: 90},
       summary: {type: 'string', maxLength: 600},
       timeline: {type: 'array', maxItems: 8, items: {type: 'string', maxLength: 160}},
       recommendedActions: {type: 'array', maxItems: 5, items: {type: 'string', maxLength: 120}}
     }
  }}
) YIELD response
SET inc.severity = answers.severity.choice,
    inc.severityConfidence = answers.severity.confidence,
    inc.title = response.title,
    inc.summary = response.summary,
    inc.timeline = response.timeline,
    inc.recommendedActions = response.recommendedActions,
    inc.briefed = response IS NOT NULL
Jev chose page for both incidents, with confidence 0.86 on each. This is the one place a model's answer controls an action, because page-on-call, below, only fires on page. Had Jev chosen ticket, the incident and its brief would still be in the graph, but nobody would be paged.
The ns-gw-01 brief's title, timeline, and recommended actions:
Appliance ns-gw-01: Attributed Crashes, Dropped File, and Outbound Callback
2026-10-29T08:22:14Z: A service crash on ns-gw-01 was attributed to attacker address 198.51.100.77. 2026-10-29T08:41:03Z: A second service crash on ns-gw-01 was attributed to attacker address 198.51.100.77. 2026-10-29T08:43:20Z: A file was dropped at /var/tmp/v, written by user 'nobody'. An outbound connection to 203.0.113.66 was recorded, which is not a known indicator of compromise. 3 user outage reports were logged within this incident window.
Investigate the source and intent of attacker address 198.51.100.77 on ns-gw-01. Review and analyze the dropped file at /var/tmp/v for malicious content. Assess the outbound connection to 203.0.113.66 to determine its purpose and risk. Correlate the 3 user outage reports with the two attributed crash events for impact analysis. Monitor ns-gw-01 for further crashes or anomalous activity linked to 198.51.100.77.
Every address, path, and timestamp in it comes from the evidence record, and the prompt forbids inventing anything else.
The brief calls the callback host "not a known indicator of compromise", which was correct when it was written, because the advisory hadn't arrived yet. It still told the responder to assess that connection.
Both briefs name only two crashes and one file for the same reason. Each was written as soon as its kill chain completed, before the later crashes and the second file write arrived. A brief is a snapshot of what the graph knew at that moment, not a final report.
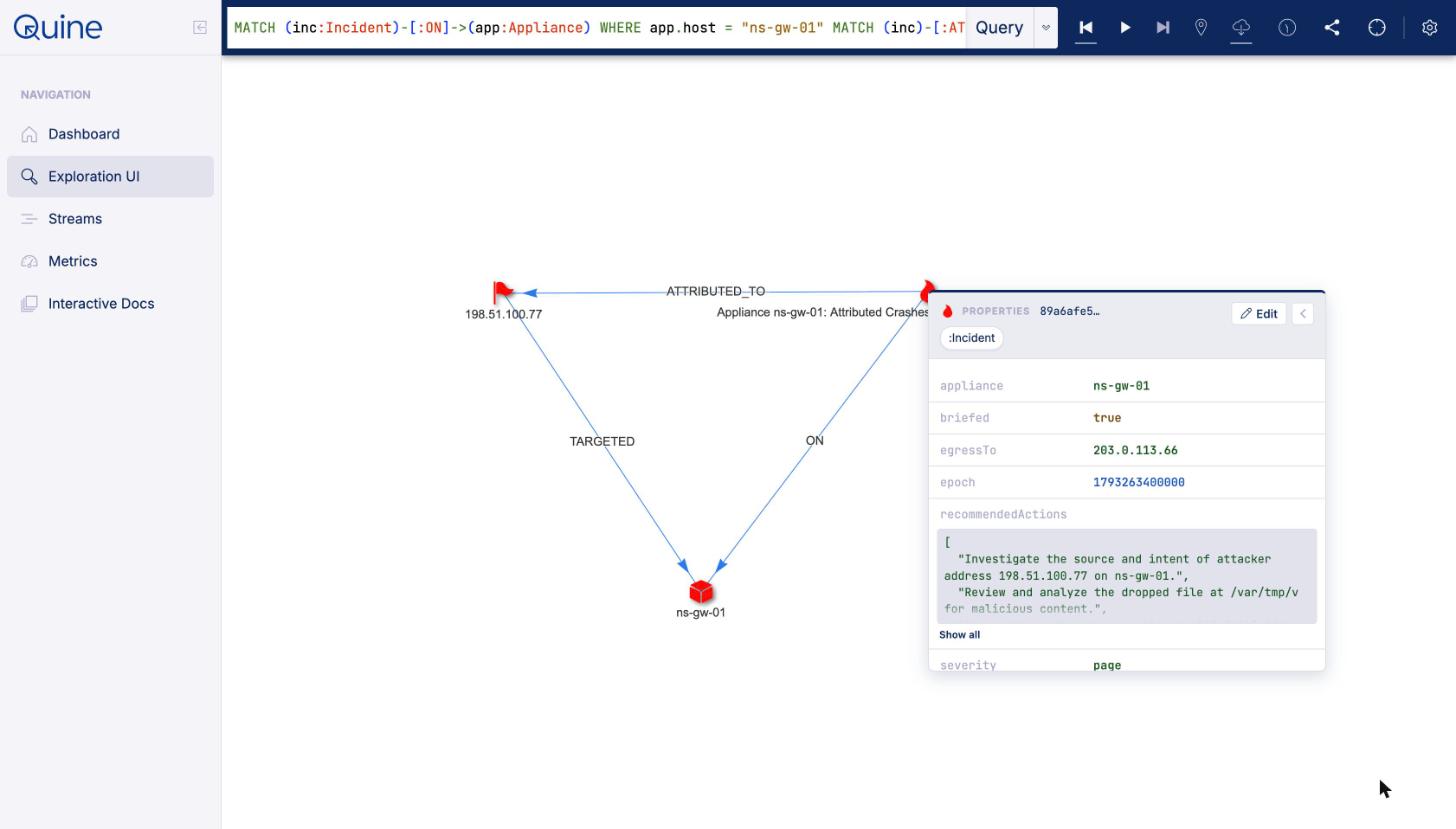
The model's output as properties on the ns-gw-01 Incident node. severity is page, the value the page-on-call standing query matches on.
MATCH (inc:Incident)-[:ON]->(app:Appliance) WHERE app.host = "ns-gw-01" MATCH (inc)-[:ATTRIBUTED_TO]->(ip) RETURN inc, app, ipRight-click the Incident node, then select "View properties".
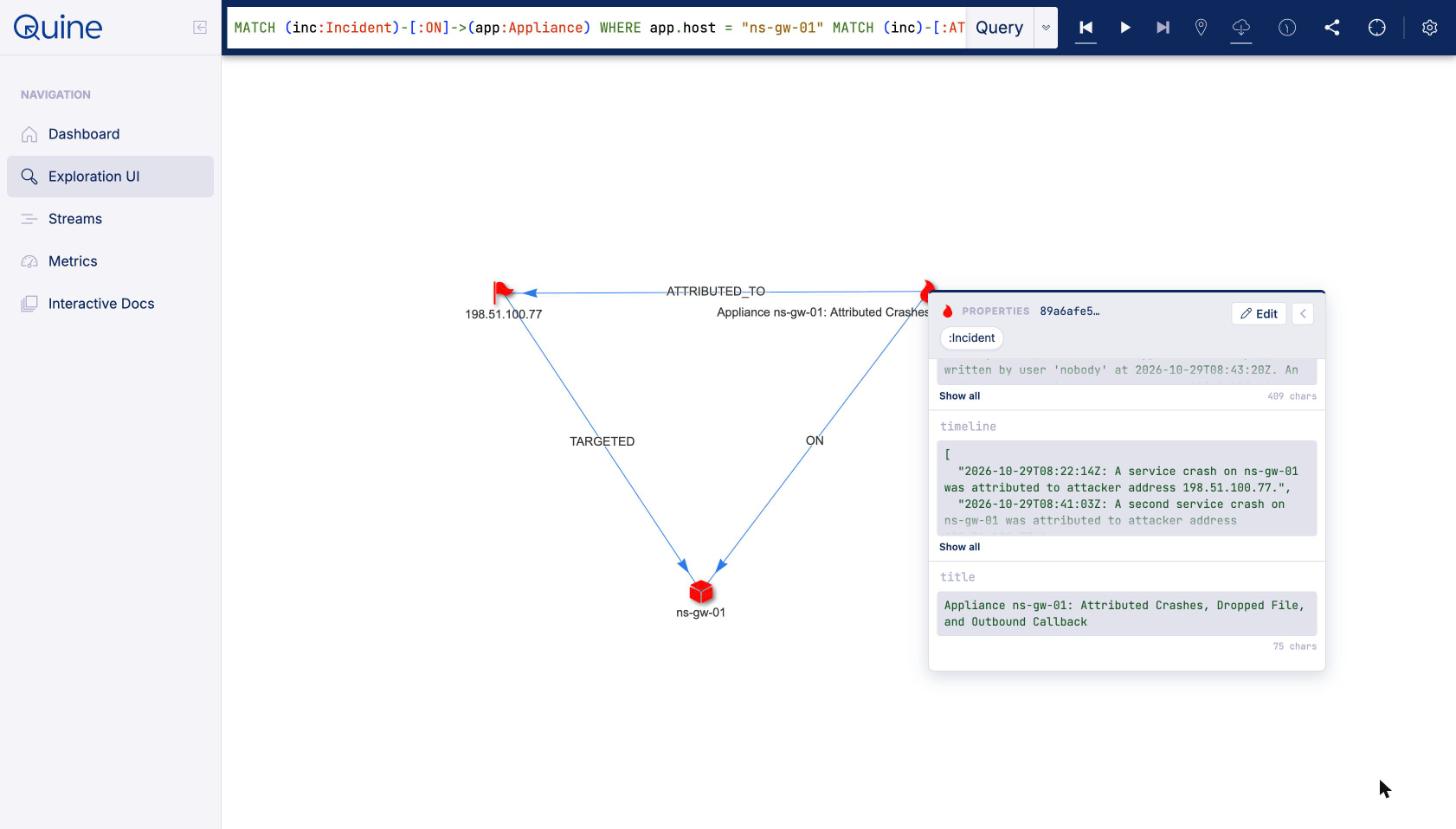
The same panel scrolled to the model's timeline, every timestamp traceable to an event node two edges away.
Same query and panel as above, scrolled down.
Sending the Page
A page decision on a node pages nobody. One more standing query sends it. It wakes when an incident's severity becomes page, reads the brief, and sends it to an output:
- name: page-on-call
  pattern:
    type: Cypher
    query: >
      MATCH (inc:Incident) WHERE inc.severity = 'page' RETURN DISTINCT id(inc) AS id
  outputs:
    - name: send-page
      resultEnrichment:
        query: |
          MATCH (inc:Incident) WHERE id(inc) = $that.data.id
          RETURN inc.appliance AS appliance, inc.title AS title, inc.summary AS summary,
                 inc.recommendedActions AS actions
      destinations:
        - type: StandardOut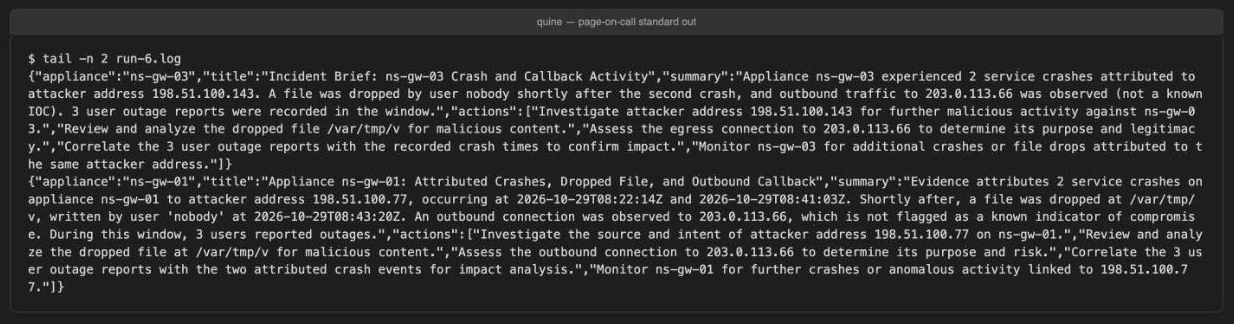
The two pages from the run, as page-on-call printed them to standard out: appliance, title, summary, and actions for each incident.
The brief stage sets the severity and the brief in one SET, so the brief is ready when this fires. The recipe prints the page to standard out. To reach a person, change the destination:
Slackposts to a Slack webhook.HttpEndpointposts JSON to any URL, such as a paging service's webhook.SNSpublishes to an AWS SNS topic, which can send SMS or email.KafkaandKinesisfeed an existing alert pipeline.
What It Cost
All numbers are from one run on the sample data: 373 records of logs, tickets, and the advisory.
Every LLM call is metered on the same metrics endpoint as everything else. The run made 199 decision calls (197 username scores, 2 severity decisions) and 13 completion calls (10 tickets, 1 advisory, 2 briefs). The run cost well under a dollar of Bedrock usage. The expensive model only ever sees ten tickets, one advisory, and two assembled incidents. It never sees the full telemetry stream. The graph decides what little the model sees.
Try It
Note: Recipe data & instructions coming soon!
The data in this post is synthetic and reproducible on a laptop with AWS and TypeSafe accounts:
- Download Quine 2.2.1 (open source, the LLM procedures included).
- Get Bedrock model access for a Claude model in your region, mint a Bedrock API key, and
note your model's inference profile id (
us.prefix). A TypeSafe key covers the decision side. - Run
java -Dconfig.file=quine.conf -jar quine-2.2.1.jar -r netscaler-llm-triage.yaml. Wait for the ingests to drain. Then runcat data/advisory.ndjson >> data/live.ndjson, and watch theIOClabel land on the callback node both incidents already point to.