

Detecting the Citrix NetScaler SAML Zero-Day (CVE-2026-88779) in Real Time with Streaming Graph
A remote-access gateway is a strange thing to attack. When it breaks the first symptom usually isn't an alert, it's angry users who can't log in. That is what makes CVE-2026-88779, the Citrix NetScaler SAML zero-day disclosed earlier this month, a hard one to live with. A single unauthenticated SAML login request overflows memory and crashes the service. Send it repeatedly and the VPN and SSO stay down for the entire workforce. CISA added it to the Known Exploited Vulnerabilities catalog within days of disclosure, and it is being exploited in the wild now against some of the largest organizations critical to the world economy.
We spend most of our time at thatDot on detections that depend on behavior over time rather than any single event, so when this one landed we built a Quine recipe for it. The recipe covers the data, the graph model, and a chain of standing queries that catch the attack as it unfolds. Only one of them looks at the payload, and nothing depends on it. The full recipe and sample data will be published alongside this post, and it runs on a laptop in about a minute.
A note on the data. The telemetry here is synthetic, modeled on the public reporting and indicators for this CVE, so we can ship the complete recipe and sample logs for you to run. The detection logic is the real content, and it is what you would deploy against live NetScaler, SAML, and firewall feeds. Every count in this post comes from running the recipe as shipped.
Why It's Hard to Catch With a Rule
Look at any single line of the attack on its own and it is unremarkable:
- A SAML authentication request with an odd username field? Auth logs are full of junk like this.
- An
nsaaadprocess crash? Appliances crash; watchdogs restart them. That's normal. - An outbound HTTPS connection from the appliance? That's normal when it phones home for updates constantly.
- A file written under the web root? Patches and config changes do that.
Each event on its own is the kind of thing that happens all the time. The signal isn't in any one of those events. It is in the relationships between them: a request to a specific appliance, then a crash on that same appliance, repeated until the watchdog reboots the box, alongside a callback to a host nobody healthy in the estate has ever talked to and a new executable on disk. That is a pattern spread across four log sources, ordered in time, and defined by repetition.
What a SIEM Does Well, and Where It Stops
To be fair to the SIEM: the first join in that list, "a request to appliance X, then a crash on appliance X within a minute," is something Splunk, Sentinel, or Elastic will do in near-real-time with a correlation rule. If that were the whole detection you would not need a graph.
The trouble starts one step later. The question that actually finds the campaign is: which source IPs keep turning up right before an appliance dies, across every appliance in the fleet, and which other appliances have those IPs touched? That is a stateful join across the whole estate with no natural time window, because the attacker's infrastructure stays interesting for as long as it exists. In a SIEM that becomes a scheduled search that maintains a lookup table, plus a second rule that consumes the lookup. Each hop you add after that (e.g. has any healthy appliance ever contacted this egress destination, a file write on the same box after the first crash, a fifth log source) is another lookup table and another schedule, and each schedule is a window in which the gateway is already down.
There is also the ordering problem. Correlation rules assume the cause arrives before the effect. When the auth log lags the system-event log by ninety seconds, the crash arrives first and the rule misses it. This is not hypothetical: in the sample run below, the system-event file is small and finishes ingesting before the auth file has started, so every crash is in the graph before the request that caused it. Handling out-of-order events is a big part of what makes drawing conclusions from real-world data such a challenge. The streaming graph handles this automatically.
Quine assembles these events into one connected picture as they arrive, lets you write derived relationships back into that picture, and evaluates the next question against them the moment they exist. Let me introduce you to Quine.
The Approach: Build the Graph, Then Let Standing Queries Watch It
Quine ingests each event, turns it into nodes and edges, and merges it into a persistent graph. So far, that's a lot like a graph database. What makes Quine different is its ability to handle millions of events every second, to connect them in real-time from many sources, and to tell you instantly when a new pattern appears. What makes the graph work across streams here is idFrom(), a deterministic function that derives a node's ID from its business key. Every event that mentions appliance ns-gw-01 resolves to the same appliance node, whether it came from the auth log, the system-event log, or the firewall. Five independent telemetry streams combine on one connected object with no join step, no locking, no merge conflicts.
On top of that graph you register standing queries, which are patterns Quine watches continuously and efficiently. A standing query doesn't scan the graph on a timer. It maintains its matches as data flows in and fires the moment a match completes—regardless of which order the events arrive. And because a standing query's output can itself write to the graph, you can chain them: one query attributes a crash to the requests that preceded it and records that as an edge; the next query watches for those edges and asks a question that only makes sense once they exist.
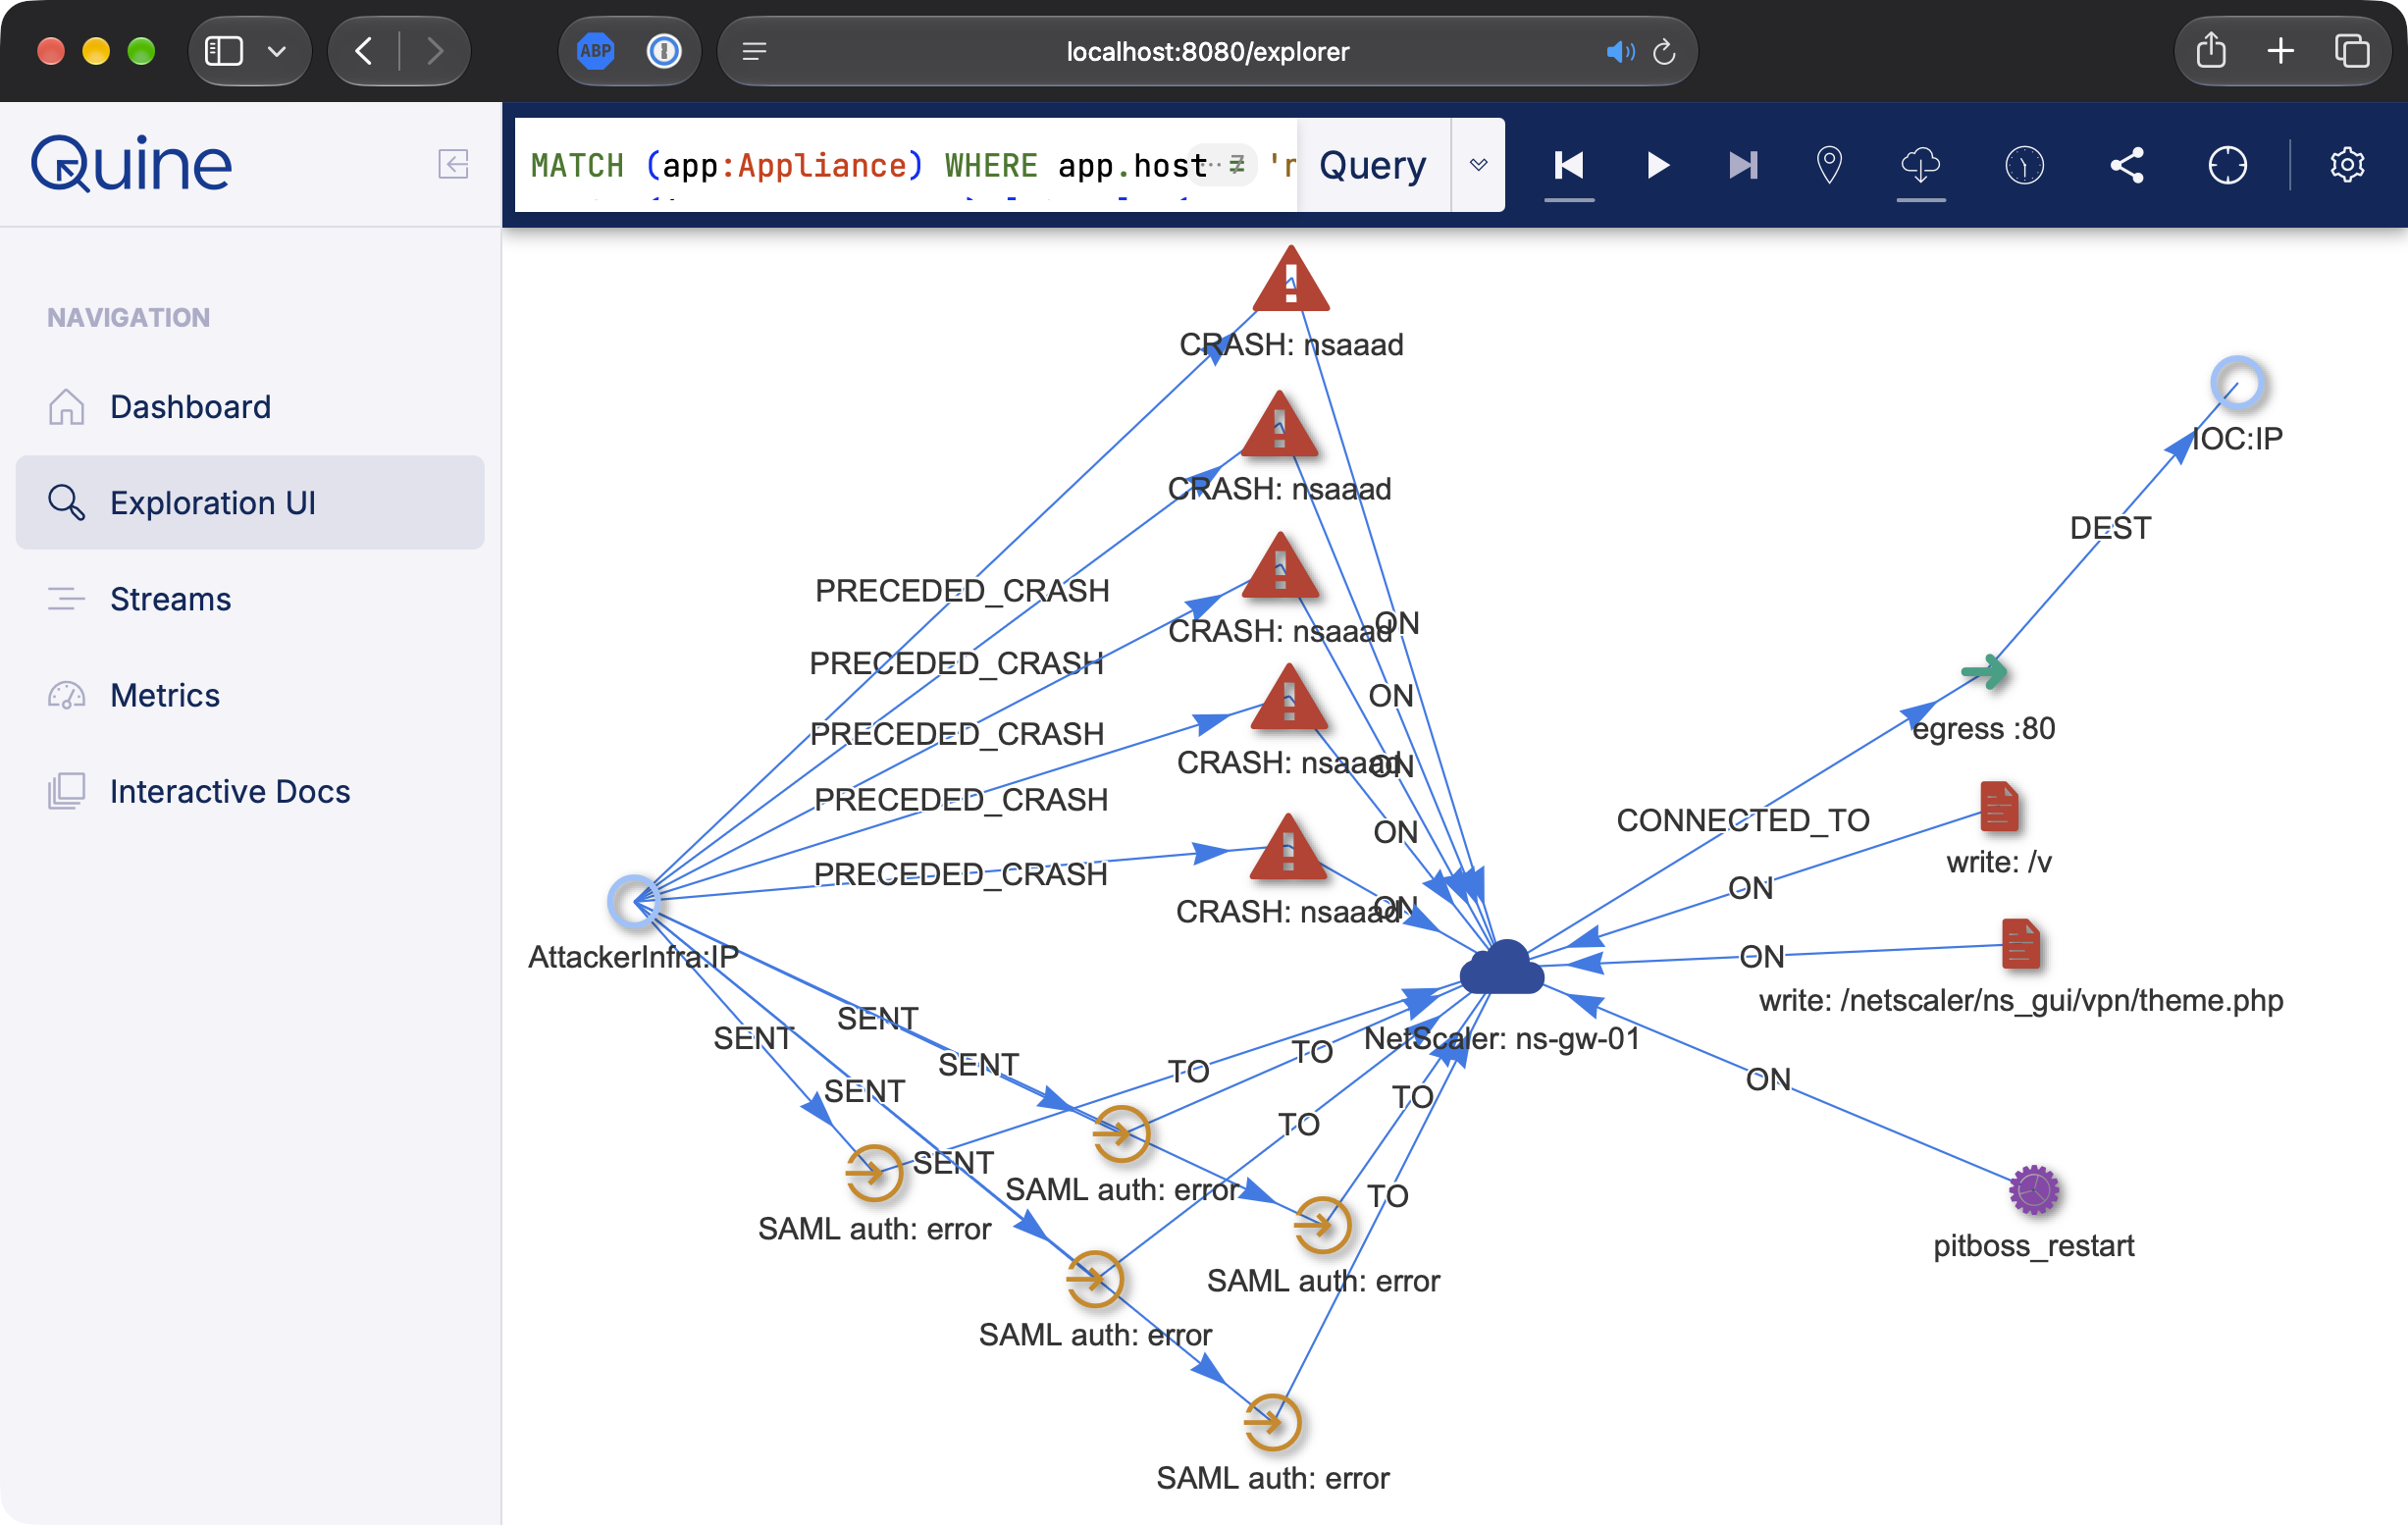 Figure 1. The full kill chain against one appliance, reconstructed as a graph. Every edge here came from a different log stream, and
idFrom() converged them on one Appliance node. The PRECEDED_CRASH edges from the attacker IP to each crash were not ingested; they were written by a standing query, as described below.
The Data Model
The recipe defines five ingest streams: four telemetry sources and a threat-intel feed. Each has a Cypher query that shapes the incoming JSON into graph structure:
(IP)-[:SENT]->(AuthEvent)-[:TO]->(Appliance)          # SAML auth log  (nsaaad)
(IP)-[:REQUESTED]->(HttpRequest)-[:TO]->(Appliance)   # HTTP access log
(SysEvent)-[:ON]->(Appliance)                         # system events: crash / reboot / file_write
(Appliance)-[:CONNECTED_TO]->(Outbound)-[:DEST]->(IP) # perimeter firewall egress
(IP:IOC)                                              # threat-intel feed

(IP)-[:PRECEDED_CRASH]->(SysEvent)                    # DERIVED by detection 1
(IP:AttackerInfra)                                    # DERIVED by detection 2
Here is the SAML auth ingest, trimmed to the fields the detections use. It upserts the source IP, the auth event, and the target appliance, then wires them together:
MATCH (ip), (auth), (app)
WHERE id(ip)   = idFrom('ip', $that.src_ip)
  AND id(auth) = idFrom('auth', $that.event_id)
  AND id(app)  = idFrom('appliance', $that.appliance)
SET ip.ip = $that.src_ip, ip:IP,
    auth.username = $that.username, auth.endpoint = $that.endpoint,
    auth.ts = $that.ts, auth.epoch = $that.epoch, auth:AuthEvent,
    app.host = $that.appliance, app:Appliance
CREATE (ip)-[:SENT]->(auth)-[:TO]->(app)
The threat-intel ingest is the smallest in the recipe. It does not create anything; it adds an IOC label to an IP node that the other streams will converge on if that IP ever shows up:
MATCH (ip) WHERE id(ip) = idFrom('ip', $that.ip)
SET ip.ip = $that.ip, ip.ioc_source = $that.source, ip.ioc_note = $that.note, ip:IP, ip:IOC
Because the ID is derived from the IP address, the IOC node and the firewall's destination node are the same node, even when they come from separate streams. In Quine you never have to create a node, you just select it and use it. There is no lookup table to maintain; the indicator is simply part of the graph. The sample feed lists one address, the publicly reported payload host. It deliberately does not list the IPs that send the requests. The recipe has to find those from behavior, and as you'll see below, it does not need the feed at all.
The modeled environment is a small network of five appliances. Four are SAML-configured and so in scope for the CVE; one is load-balancing only. One of the SAML appliances, ns-aaa-01, is already on a fixed build, which matters later.
The sample dataset is 4,850 records. Almost all of it is benign: normal logins, access-log noise, ordinary egress, and a couple of unrelated one-off process crashes. Two complete exploitation sequences and one decoy are buried inside it. In the real world, these numbers are much higher, but to keep this demonstration understandable, it’s kept small.
The Detections: Attribute, Pivot, Then Kill Chain
The recipe layers eight standing queries, which make up a signature and five detections. The signature comes first, and we include it because it is what most people reach for first. The rest do not look at the payload. They work from timing, repetition, and the shape of the graph, which means they keep working when the attacker changes the string in the username field.
0. The signature (enrichment, not a gate)
Reporting on this CVE described shell commands smuggled into the SAML username field alongside overflow-length values. This standing query flags any authentication event whose username carries that shape:
MATCH (ip:IP)-[:SENT]->(auth:AuthEvent)-[:TO]->(app:Appliance)
WHERE auth.username =~ '.*([;&|]|curl|wget|nslookup|A{200,}).*'
RETURN DISTINCT id(auth) AS id
Let’s be clear about what this is: It's basically a Snort rule written in Cypher. It is cheap, it is immediate, and it is trivially evaded: encode the payload, use a different separator, pad with a different character, or run a command that isn't on the list. If this were a key part of detection, it would be an argument for sticking with traditional tools. But this step gates nothing. It sets auth.signature_hit = true so an analyst opening the subgraph sees it, and that is all it does. It’s a visual cue for humans we can take or leave. The actual important steps are what happens next.
1. Crash-precursor attribution
The first real detection asks the question an incident responder asks when a daemon dies: what was the last thing that touched this box? It wakes on every nsaaad crash, finds the SAML requests to the same appliance in the sixty seconds before the crash, and writes an edge from each source IP to the crash:
// pattern: wake on every nsaaad crash
MATCH (crash:SysEvent)-[:ON]->(app:Appliance)
WHERE crash.event_type = 'process_crash' AND crash.process = 'nsaaad'
RETURN DISTINCT id(crash) AS id
// output: attribute the crash to whoever was talking to the appliance just before it
MATCH (crash:SysEvent)-[:ON]->(app:Appliance)
WHERE id(crash) = $that.data.id
MATCH (ip:IP)-[:SENT]->(auth:AuthEvent)-[:TO]->(app)
WHERE auth.epoch <= crash.epoch AND auth.epoch >= crash.epoch - 60000
CREATE (ip)-[:PRECEDED_CRASH]->(crash)A second standing query is the mirror image: it wakes on every auth event and looks forward sixty seconds for a crash, writing the same edge. Edge writes in Quine are idempotent, so whichever log arrives last completes the attribution. In the sample run, the mirror wrote all fourteen edges, because every crash was in the graph before its request. If you have ever lost a correlation to log lag, that is the fix.
On its own this is weak evidence. In the sample data, three legitimate users happened to log in within a minute of a crash on their gateway, and each of them got a PRECEDED_CRASH edge. One of them, with a single login, landed inside the window of two consecutive crashes. That is fine, because this query is not the alert. Its job is to put a derived relationship into the graph that the next query can reason about. We’re climbing a “ladder of abstraction” by automatically building a richer graph.
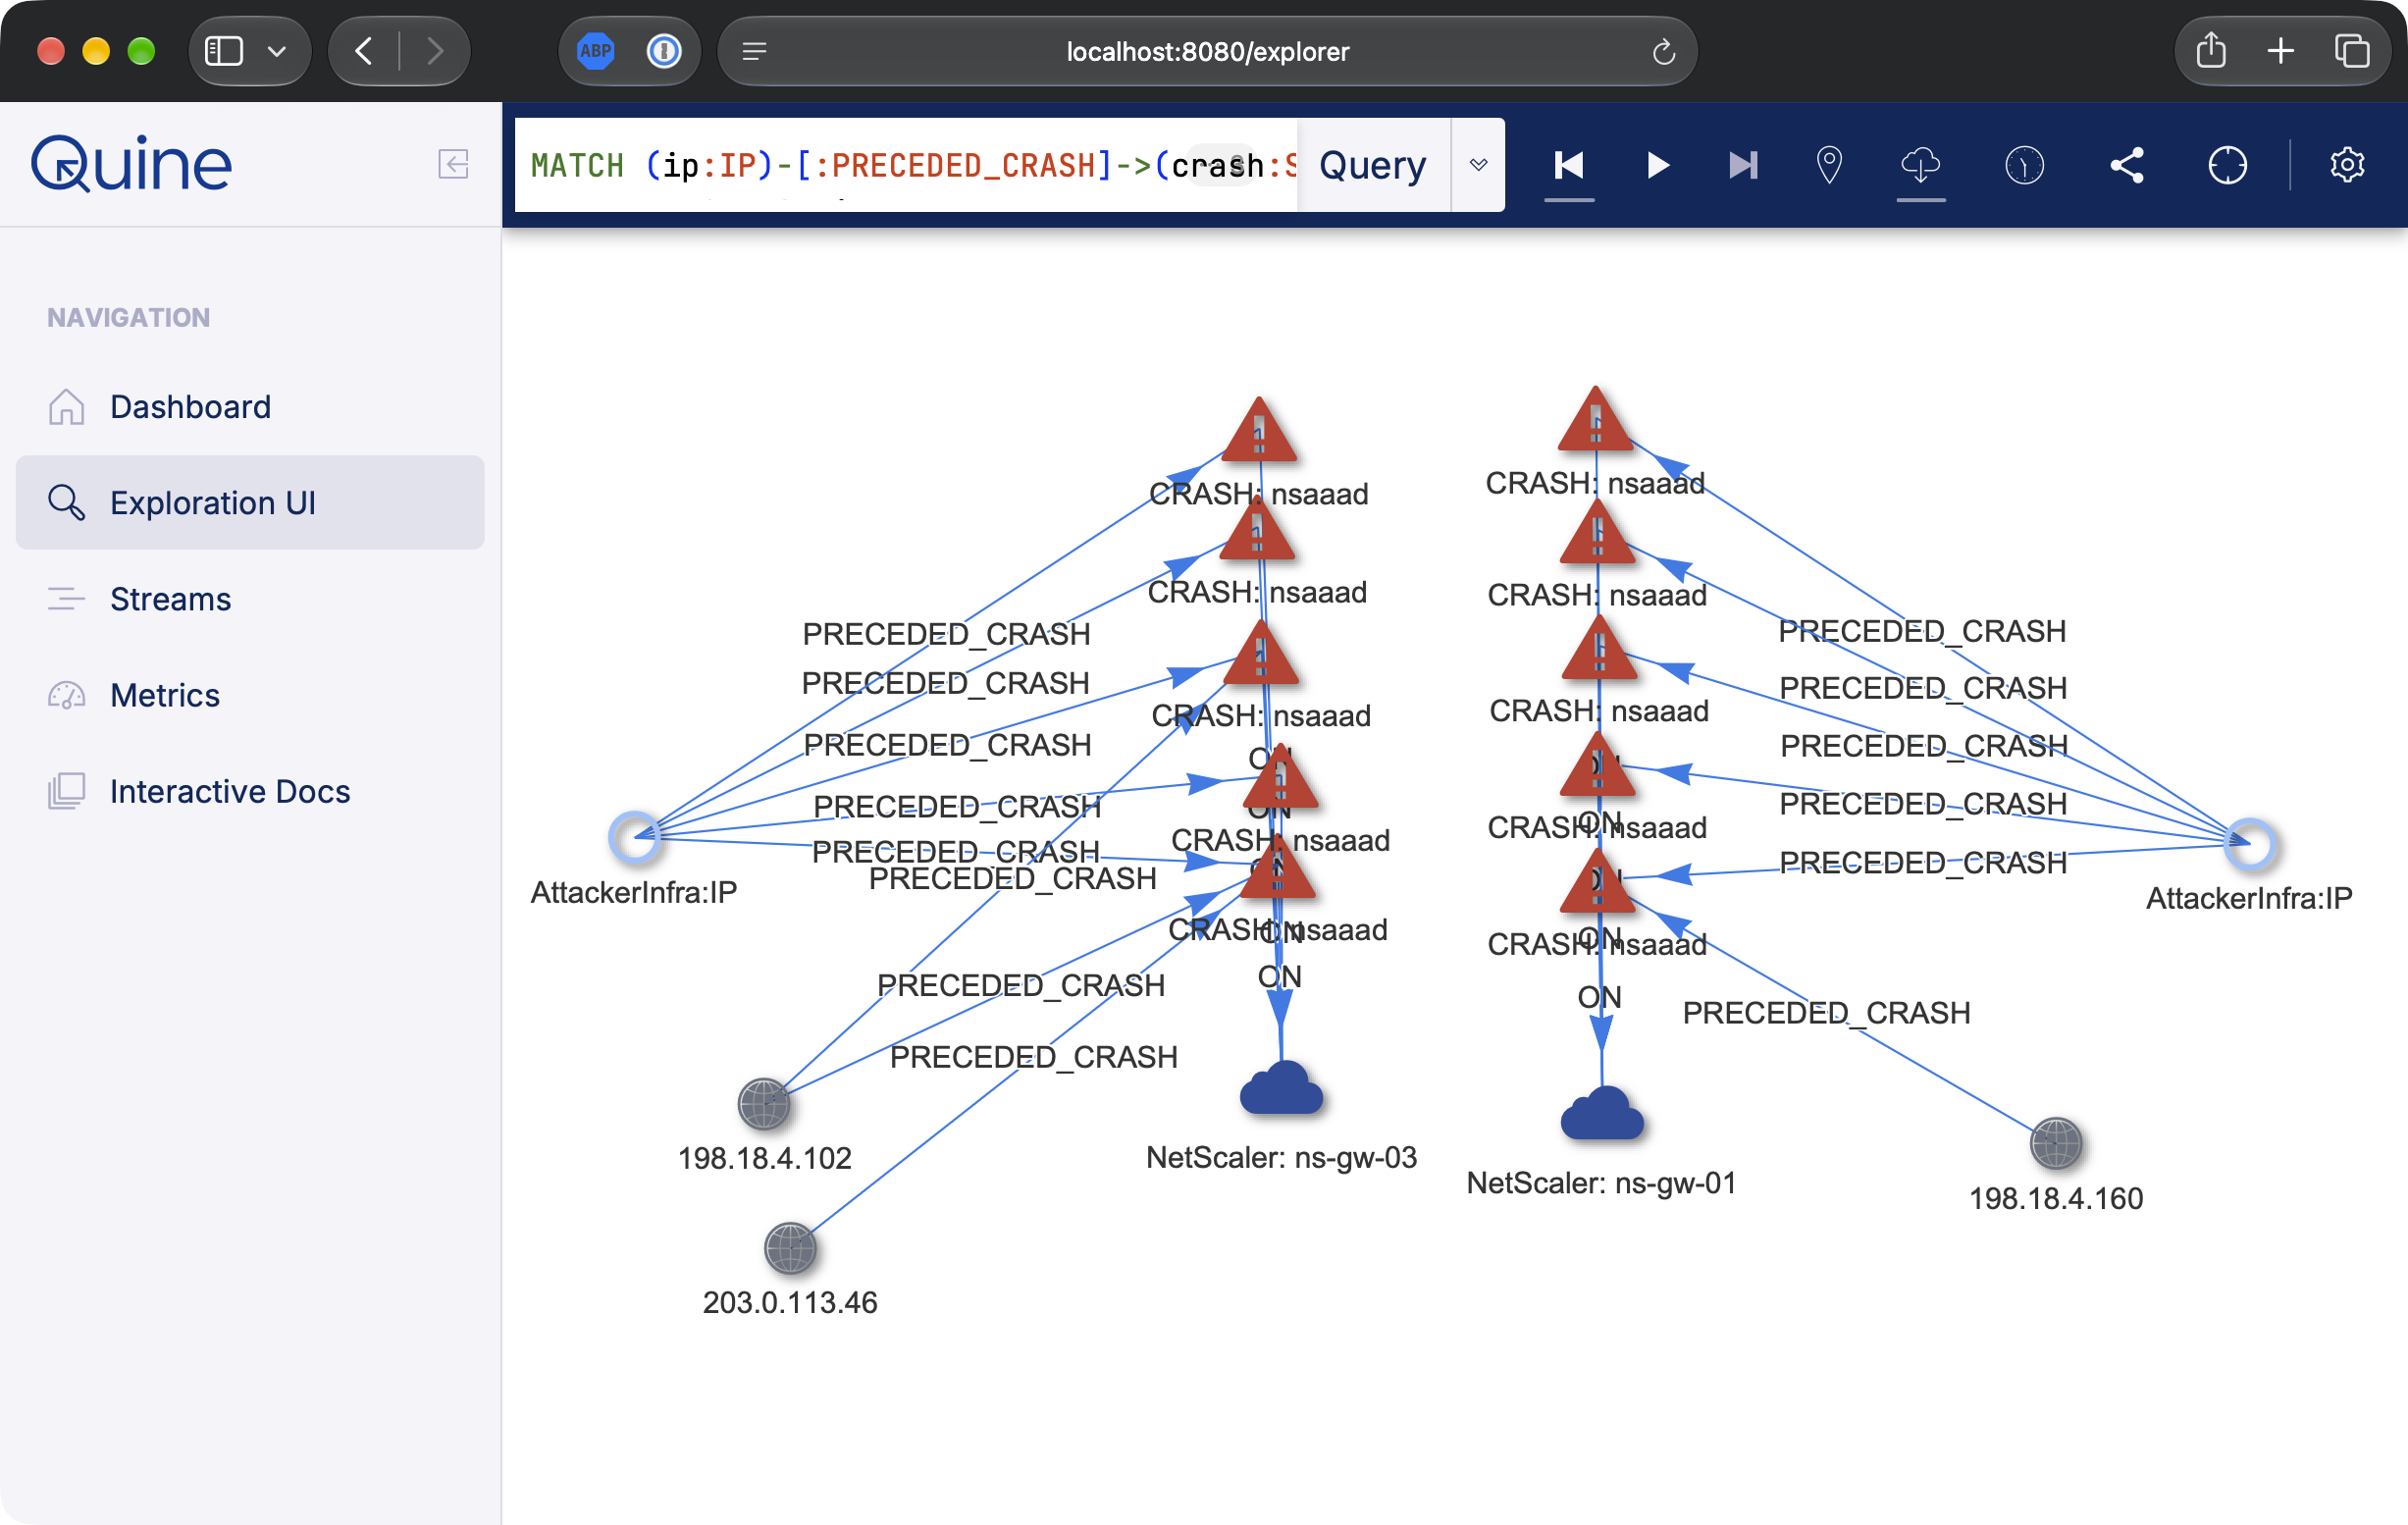 Figure 2. Crash attribution across both compromised gateways. The two attacker IPs account for five edges each. Three legitimate users picked up edges by logging in at the wrong moment;
198.18.4.102 landed inside the window of two consecutive crashes with one request. None of the three is promoted by the next step.
2. Shared infrastructure, and every appliance it has touched
Now the graph does something a per-appliance rule cannot. A standing query watches for the derived edge, pivots to the IP, and counts across the whole estate: how many crashes has this IP preceded, and with how many distinct requests?
// pattern: wake on each new attribution edge, once per (ip, crash) pair
MATCH (ip:IP)-[:PRECEDED_CRASH]->(crash:SysEvent)
RETURN id(ip) AS ip, id(crash) AS crash
// output: promote the IP when the evidence crosses the threshold
MATCH (ip:IP) WHERE id(ip) = $that.data.ip
MATCH (ip)-[:PRECEDED_CRASH]->(c:SysEvent)-[:ON]->(app:Appliance)
MATCH (ip)-[:SENT]->(a:AuthEvent)-[:TO]->(app)
WHERE a.epoch <= c.epoch AND a.epoch >= c.epoch - 60000
WITH ip, count(DISTINCT c) AS crashes_preceded, count(DISTINCT a) AS requests_before_crashes
WHERE crashes_preceded >= 2 AND requests_before_crashes >= 2
SET ip.attacker_infra = true, ip:AttackerInfraThe two-request requirement is what clears the bystander who logged in once before a pair of back-to-back crashes. One login, two crashes: not promoted. Five requests, five crashes: promoted. A separate standing query rooted at the AttackerInfra label emits the alert, which guarantees exactly one alert per IP no matter how many attribution edges land at once.
The next query is the one that makes the graph approach especially worthwhile. The moment an IP is labelled, every appliance it has ever sent a request to becomes interesting, including the ones that have not crashed:
// pattern: any appliance that attacker infrastructure has talked to
MATCH (ip:AttackerInfra)-[:SENT]->(auth:AuthEvent)-[:TO]->(app:Appliance)
RETURN DISTINCT id(app) AS id
// output: report the appliance's state, crashed or not
MATCH (app:Appliance) WHERE id(app) = $that.data.id
MATCH (ip:AttackerInfra)-[:SENT]->(auth:AuthEvent)-[:TO]->(app)
WITH app, collect(DISTINCT ip.ip) AS attacker_ips, count(DISTINCT auth) AS requests
OPTIONAL MATCH (c:SysEvent)-[:ON]->(app)
WHERE c.event_type = 'process_crash' AND c.process = 'nsaaad'
WITH app, attacker_ips, requests, count(DISTINCT c) AS nsaaad_crashes
RETURN 'exposed-appliance' AS detection, app.host AS appliance,
attacker_ips, requests, nsaaad_crashes,
CASE WHEN nsaaad_crashes > 0 THEN 'compromised'
ELSE 'probed, no crash: verify build' END AS assessmentThis is a two-hop traversal through a shared node: appliance → attacker IP → every other appliance. It runs over the whole history of the graph, not a window, because the edges are already there. And it fires for appliances that have shown no symptoms, which is the list you actually want at 9 a.m. the morning after. We come back to this in the decoy section.
3. The denial of service itself
The attacker's objective is to keep the gateway down, which means triggering the crash over and over. This detection ignores attribution entirely and watches for three nsaaad crashes on one appliance inside a fifteen-minute trailing window:
// output: alert on the crash whose trailing-window count hits the threshold
MATCH (crash:SysEvent)-[:ON]->(app:Appliance)
WHERE id(crash) = $that.data.id
MATCH (other:SysEvent)-[:ON]->(app)
WHERE other.event_type = 'process_crash' AND other.process = 'nsaaad'
  AND other.epoch <= crash.epoch AND other.epoch >= crash.epoch - 900000
WITH app, crash, count(DISTINCT other) AS nsaaad_crashes, min(other.epoch) AS t0
WHERE nsaaad_crashes = 3
RETURN 'repeated-crash-dos' AS detection, app.host AS appliance,
       nsaaad_crashes, (crash.epoch - t0) AS window_ms
The window is bounded, so three crashes spread over a year do not fire. And the threshold is an equality, not a >=: the alert belongs to the one crash whose trailing count is exactly three, so an episode produces one alert rather than one on crash three, four, five, and six. Scoping to process = 'nsaaad' keeps it quiet during the ordinary, isolated httpd crashes that also show up in the sample data.
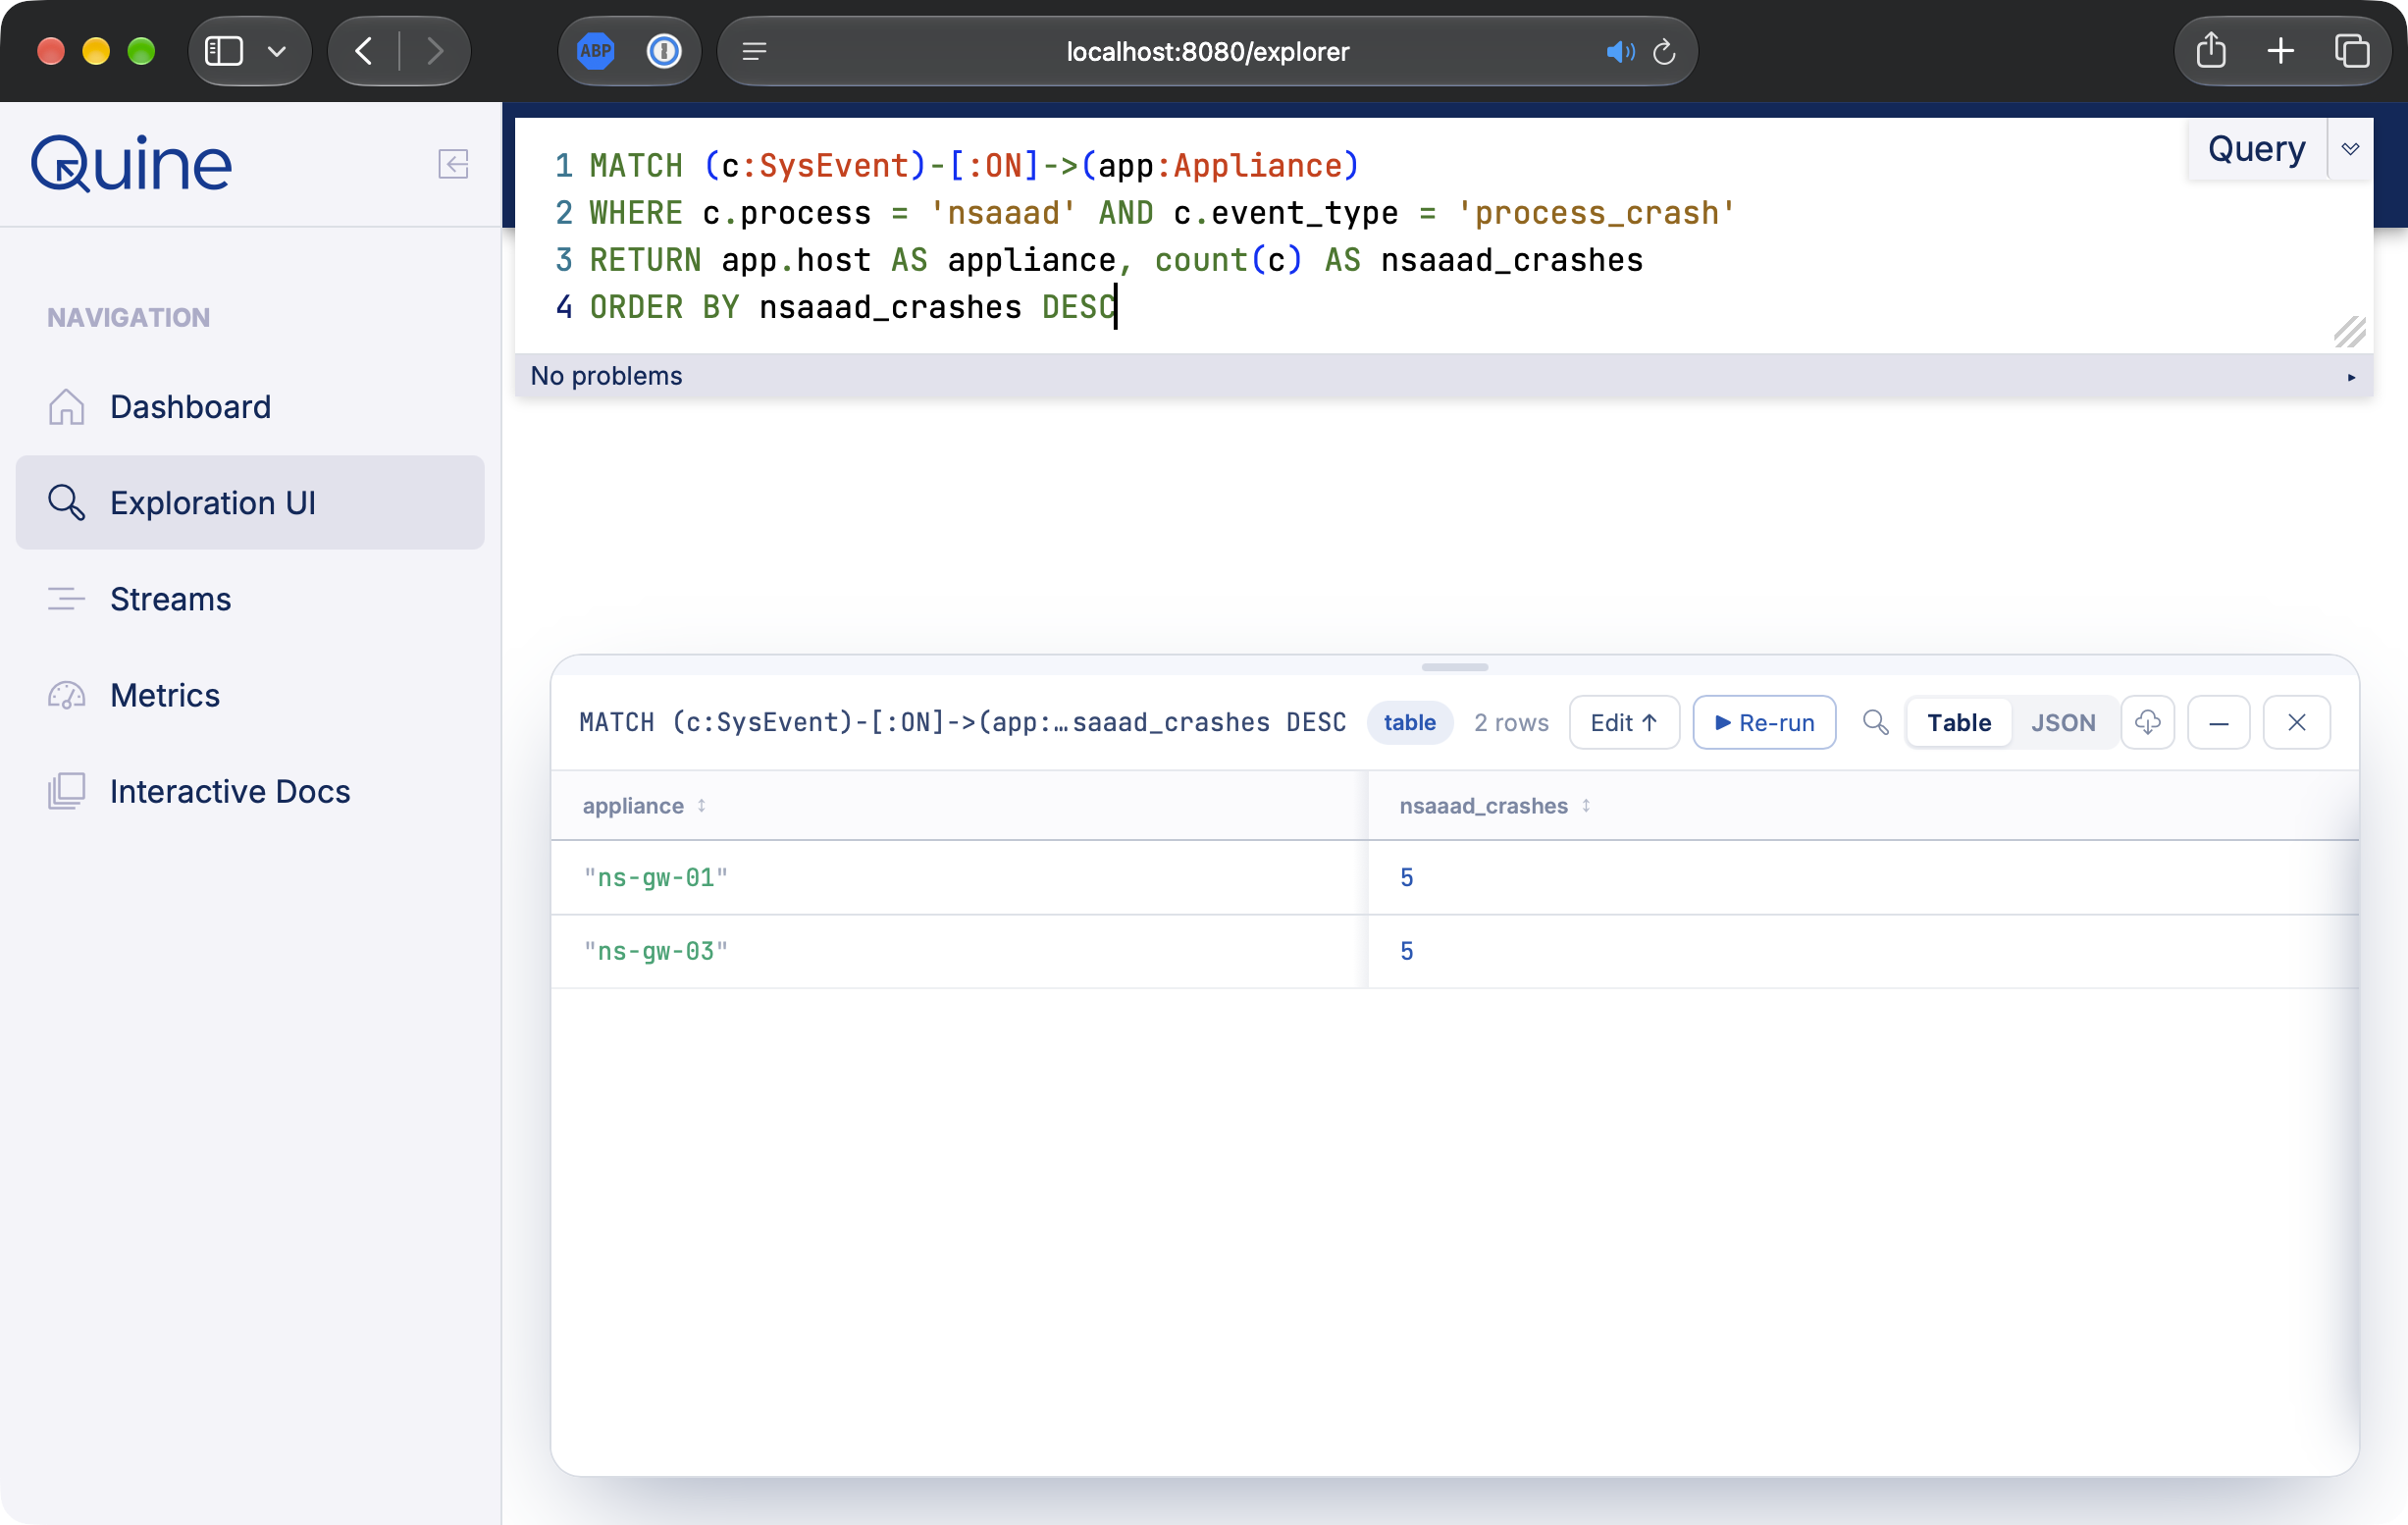 Figure 3. The denial-of-service view:
nsaaad crash counts by appliance. Two appliances are being held down, and the rest are quiet.
4. The post-exploitation kill chain
The last query looks for the arc that points past a nuisance outage: a file dropped on an appliance after a crash attributed to known attacker infrastructure, plus an outbound connection from that appliance to somewhere it should not be talking to. Detection is an important first step, but then we go even further: has any healthy appliance in the network ever contacted the detected IP?
// pattern: built entirely from derived elements, so it completes when attribution does
MATCH (ip:AttackerInfra)-[:PRECEDED_CRASH]->(c:SysEvent)-[:ON]->(app:Appliance)<-[:ON]-(fw:SysEvent)
WHERE fw.event_type = 'file_write'
RETURN DISTINCT id(fw) AS id
// output: file write after the first attributed crash, plus egress no healthy box has made
MATCH (fw:SysEvent)-[:ON]->(app:Appliance) WHERE id(fw) = $that.data.id
MATCH (ip:AttackerInfra)-[:PRECEDED_CRASH]->(c:SysEvent)-[:ON]->(app)
WITH fw, app, min(c.epoch) AS first_attributed_crash, collect(DISTINCT ip.ip) AS attacker_ips
WHERE fw.epoch > first_attributed_crash
MATCH (app)-[:CONNECTED_TO]->(o:Outbound)-[:DEST]->(dst:IP)
WHERE o.epoch > first_attributed_crash
WITH DISTINCT fw, app, attacker_ips, dst, 'IOC' IN labels(dst) AS known_ioc
MATCH (app2:Appliance)-[:CONNECTED_TO]->(o2:Outbound)-[:DEST]->(dst)
OPTIONAL MATCH (x:AttackerInfra)-[:PRECEDED_CRASH]->(c2:SysEvent)-[:ON]->(app2)
WHERE c2.epoch < o2.epoch
WITH fw, app, attacker_ips, dst, known_ioc, o2, count(c2) AS attributed_crashes_before_contact
WITH fw, app, attacker_ips, dst, known_ioc, count(o2) AS estate_contacts,
sum(CASE WHEN attributed_crashes_before_contact = 0 THEN 1 ELSE 0 END) AS healthy_contacts
WHERE known_ioc OR healthy_contacts = 0
RETURN 'post-exploitation-chain' AS detection, app.host AS appliance, attacker_ips,
fw.path AS dropped_file, fw.user AS written_by, dst.ip AS egress_to, estate_contacts,
CASE WHEN known_ioc THEN 'known IOC'
ELSE 'no healthy appliance has ever contacted this host' END AS reasonThe "healthy contact" test is what makes this a particularly good streaming graph problem. dst is one node. Every firewall record from every appliance that ever reached that host hangs off it (so Quine’s Supernode Support is especially important!). For each of those connections, the query hops into the connecting appliance and asks whether it was already past an attributed crash at the moment it connected. If every contact in the network's history was made by an already-compromised box, nobody healthy has ever had a reason to talk to this host. That is a three-hop aggregate through a shared node, it has no time window, and it keeps working for the second, third, and tenth victim.
We ran the recipe with the threat-intel feed emptied. All four kill-chain alerts still fire, with the reason switched to no healthy appliance has ever contacted this host. The feed is a shortcut, not a dependency. And that’s critical if you are responsible for front-line defense when new variants occur.
Every alert carries an explore link that opens the matched subgraph in the Exploration UI, one click from alert to investigation:
{"detection":"exposed-appliance","severity":"medium","appliance":"ns-aaa-01",
 "attacker_ips":["193.42.33.88"],"requests":3,"nsaaad_crashes":0,
 "assessment":"probed, no crash: verify build",
 "explore":"http://localhost:8080/#..."}
The Decoy
The sample data includes a third appliance, ns-aaa-01, that receives requests from 193.42.33.88, the same IP that takes down ns-gw-01. It is already patched, so it never crashes. Run the recipe and the split is clean:
exposed-appliancereportsns-aaa-01withnsaaad_crashes: 0and the assessment probed, no crash: verify build. It got there without reading a single username. It got there because the IP that hit it is the IP that was promoted toAttackerInfrafor what it did tons-gw-01.- The DoS and kill-chain detections stay silent on it, because nothing happened next.
The signature would also have flagged ns-aaa-01, but it flags it for the same reason it flags the compromised boxes, and tells you nothing about which is which. The graph tells you that this appliance is on the attacker's target list and has survived so far. Confirm the build, and move on to the two that did not.
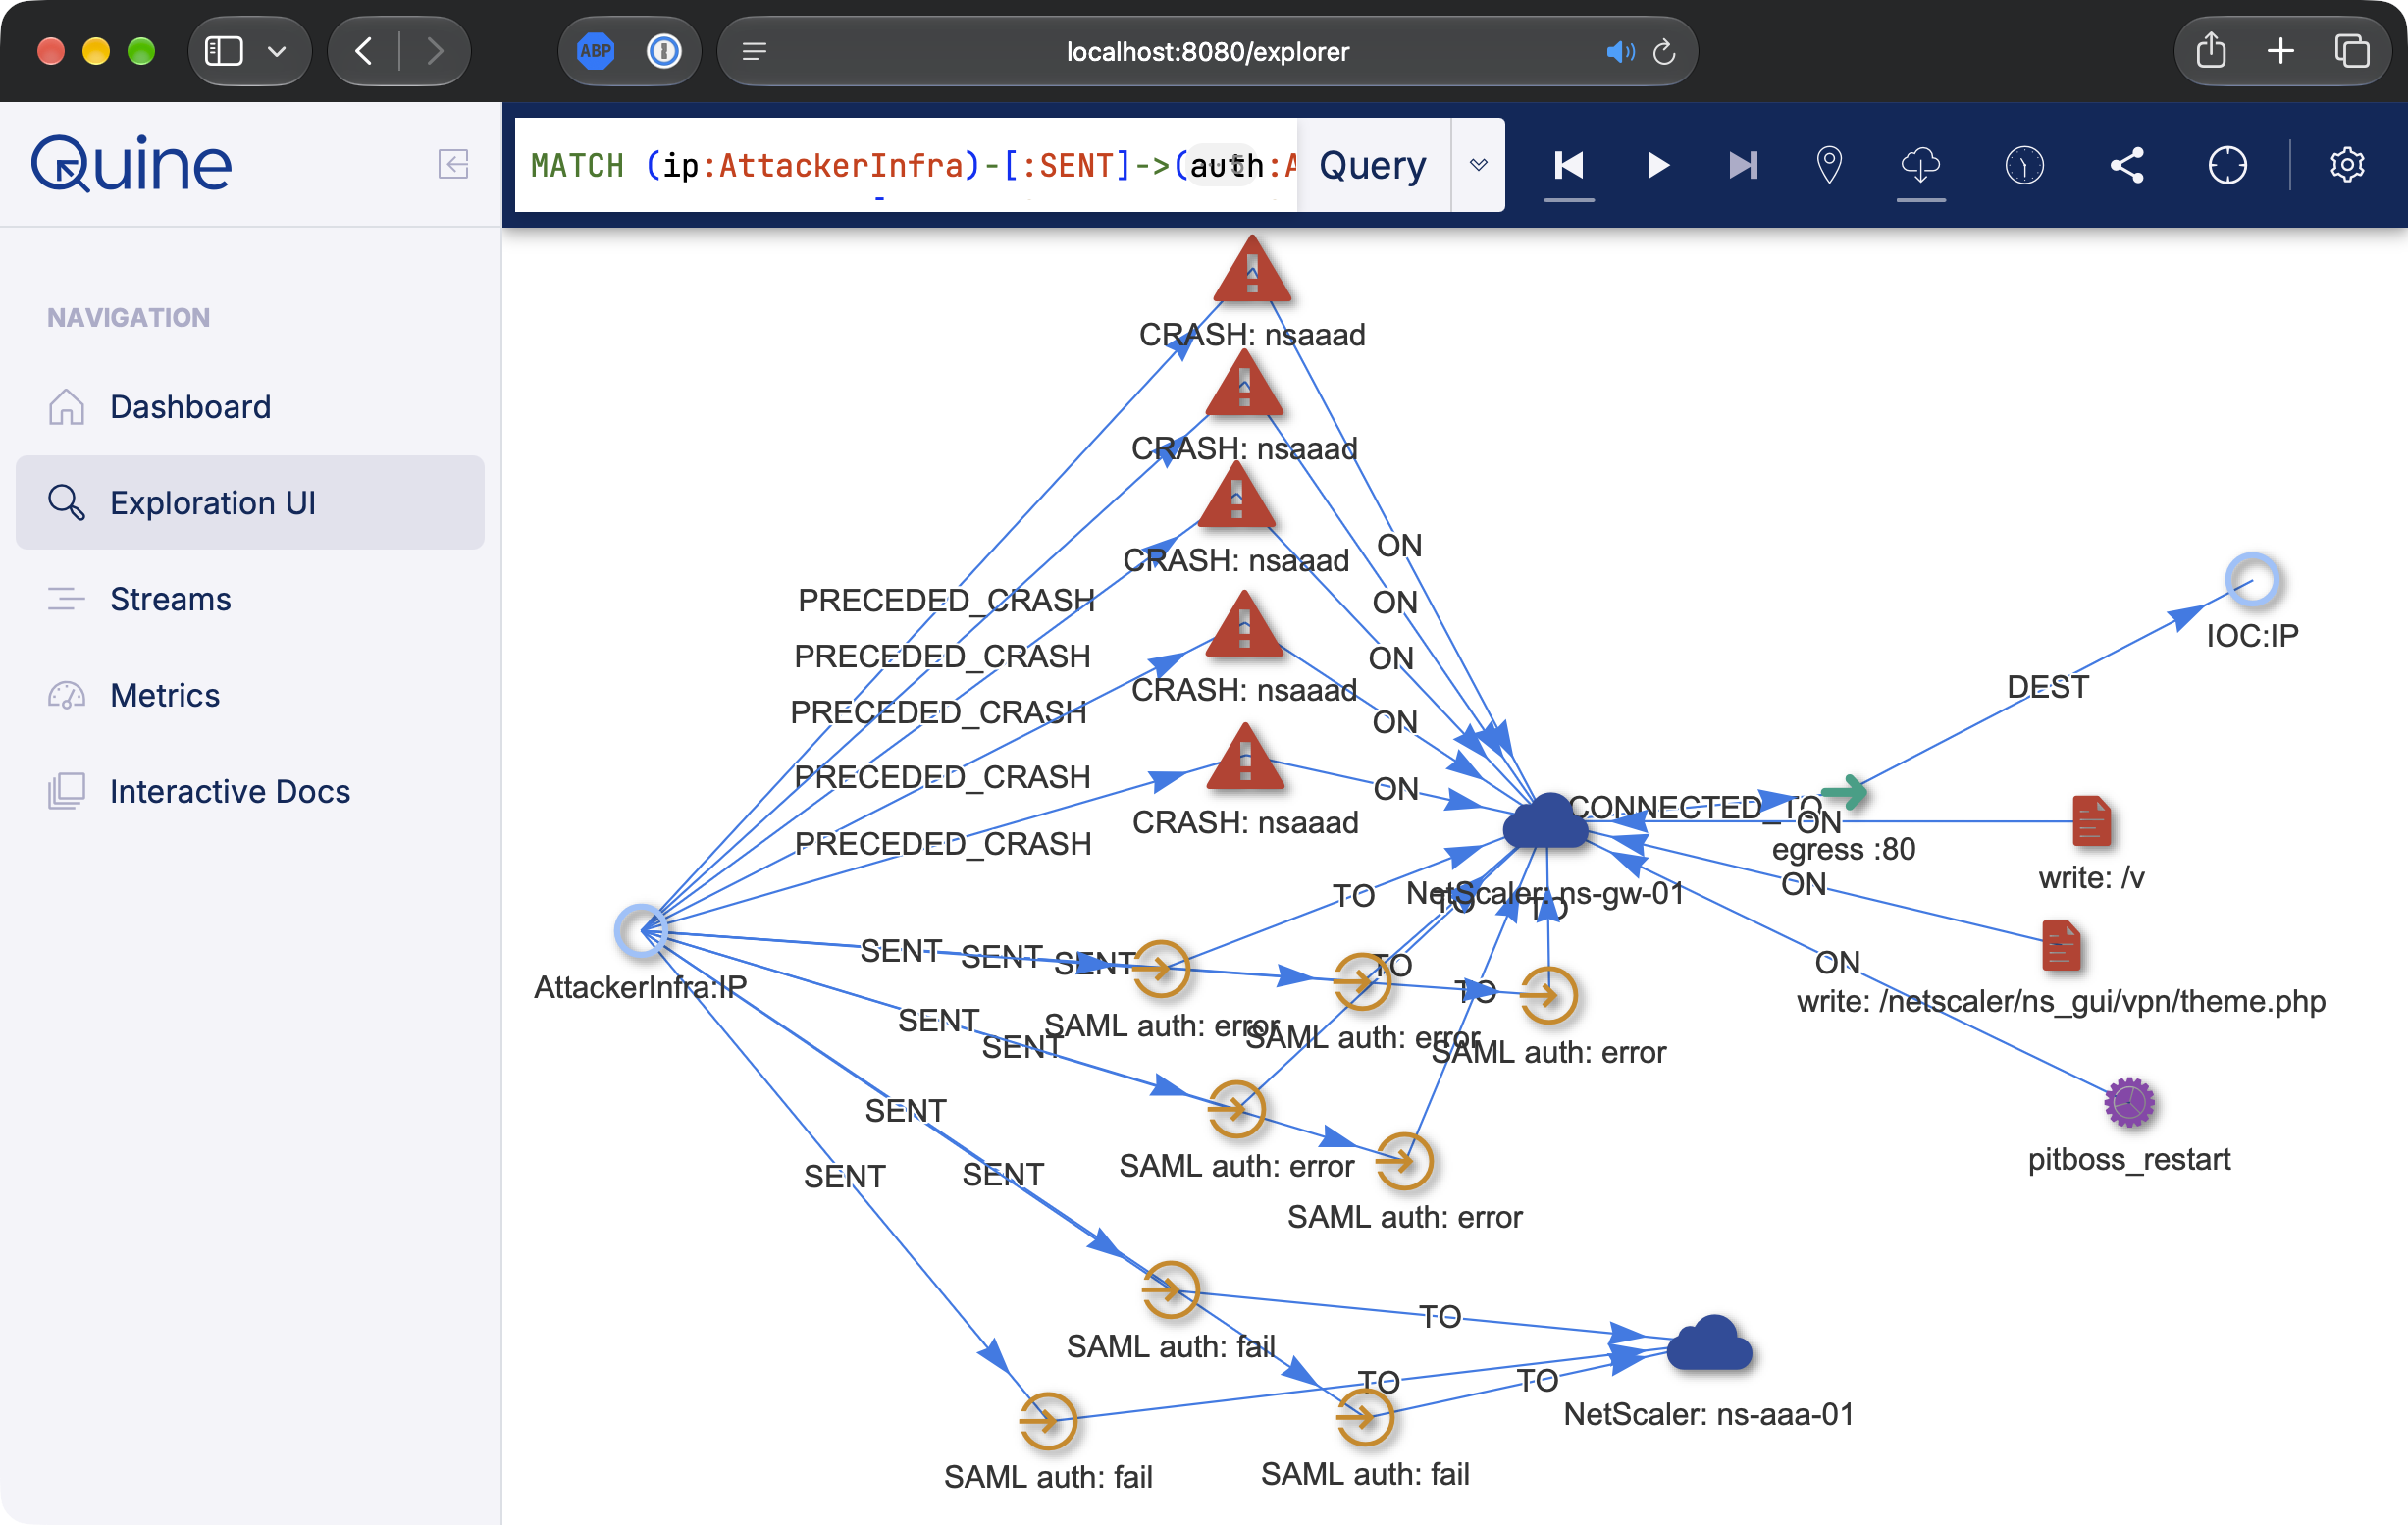 Figure 4. Same attacker, different outcomes. Both gateways received requests from the same infrastructure. Only the unpatched
ns-gw-01 grew the attributed crashes, the callback to the payload host, and the dropped files that mark a compromise. The patched ns-aaa-01 has nothing attached but the three requests, and the pivot through the shared attacker IP is what surfaces it.
Measuring What Fires
The recipe is deterministic: the generator is seeded, and five consecutive runs produced identical output.
| Standing query | Fires | What it means |
|---|---|---|
ioc-signature (enrichment) | 13 requests across 3 appliances | Payload shape matches public reporting; annotation only |
crash-precursor | 14 edges on 10 crashes | 10 from the two attacker IPs, 4 from three benign bystanders |
attacker-infrastructure | 2 IPs, once each | 5 crashes preceded with 5 requests, each |
exposed-appliance | 3 appliances | 2 compromised, 1 probed, no crash (the patched decoy) |
repeated-crash-dos | 2 appliances, once each | 3 crashes in 15.3 s and 15.9 s respectively |
post-exploitation-chain | 4 (2 files × 2 appliances) | /v and a PHP file under ns_gui, written by nobody, with egress no healthy appliance has made |
The three bystanders are the false-positive story for this recipe. All three picked up attribution edges. None was promoted, and the one that preceded two crashes was stopped by the two-request rule. A real fleet has more logins per minute than this sample, so the bystander count will be higher and the thresholds would be tuned for the environment; the shape of the rule, requiring repetition from one source across multiple crashes, is what keeps the promotion rate low. We’re using the graph to build new layers in the graph which are increasingly meaningful and increasingly reliable.
Why Streaming Graph Fits This Problem
Four things about Quine stand out, and they apply well beyond this one CVE.
idFrom()puts five streams, including the threat-intel feed, on one shared graph with no join keys, no window alignment, and no pre-correlation ETL. Add a sixth source such as EDR, DNS, or identity-provider logs and it attaches to the same nodes without changing what's already in place.- Standing queries keep their matches current as data arrives and fire the instant a pattern completes, in whatever order the pieces land, rather than on the next scheduled scan. For an attack measured in minutes of downtime, that latency gap matters.
- Standing queries can write derived relationships back into the graph, and other standing queries can watch for those. The attribution edge, the
AttackerInfralabel, and the healthy-contact aggregate are each a small piece of analyst reasoning encoded once and evaluated continuously. The payload regex is the only part of this recipe an attacker can route around by changing a string, and nothing depends on it. - Real data will naturally create Supernodes, which is a node with a high number of edges. Traditional graph systems degrade performance or even crash with as little as a few dozen edges. Quine is built to support massive graphs and tested beyond 500 million edges per node. Real data requires handling Supernodes.
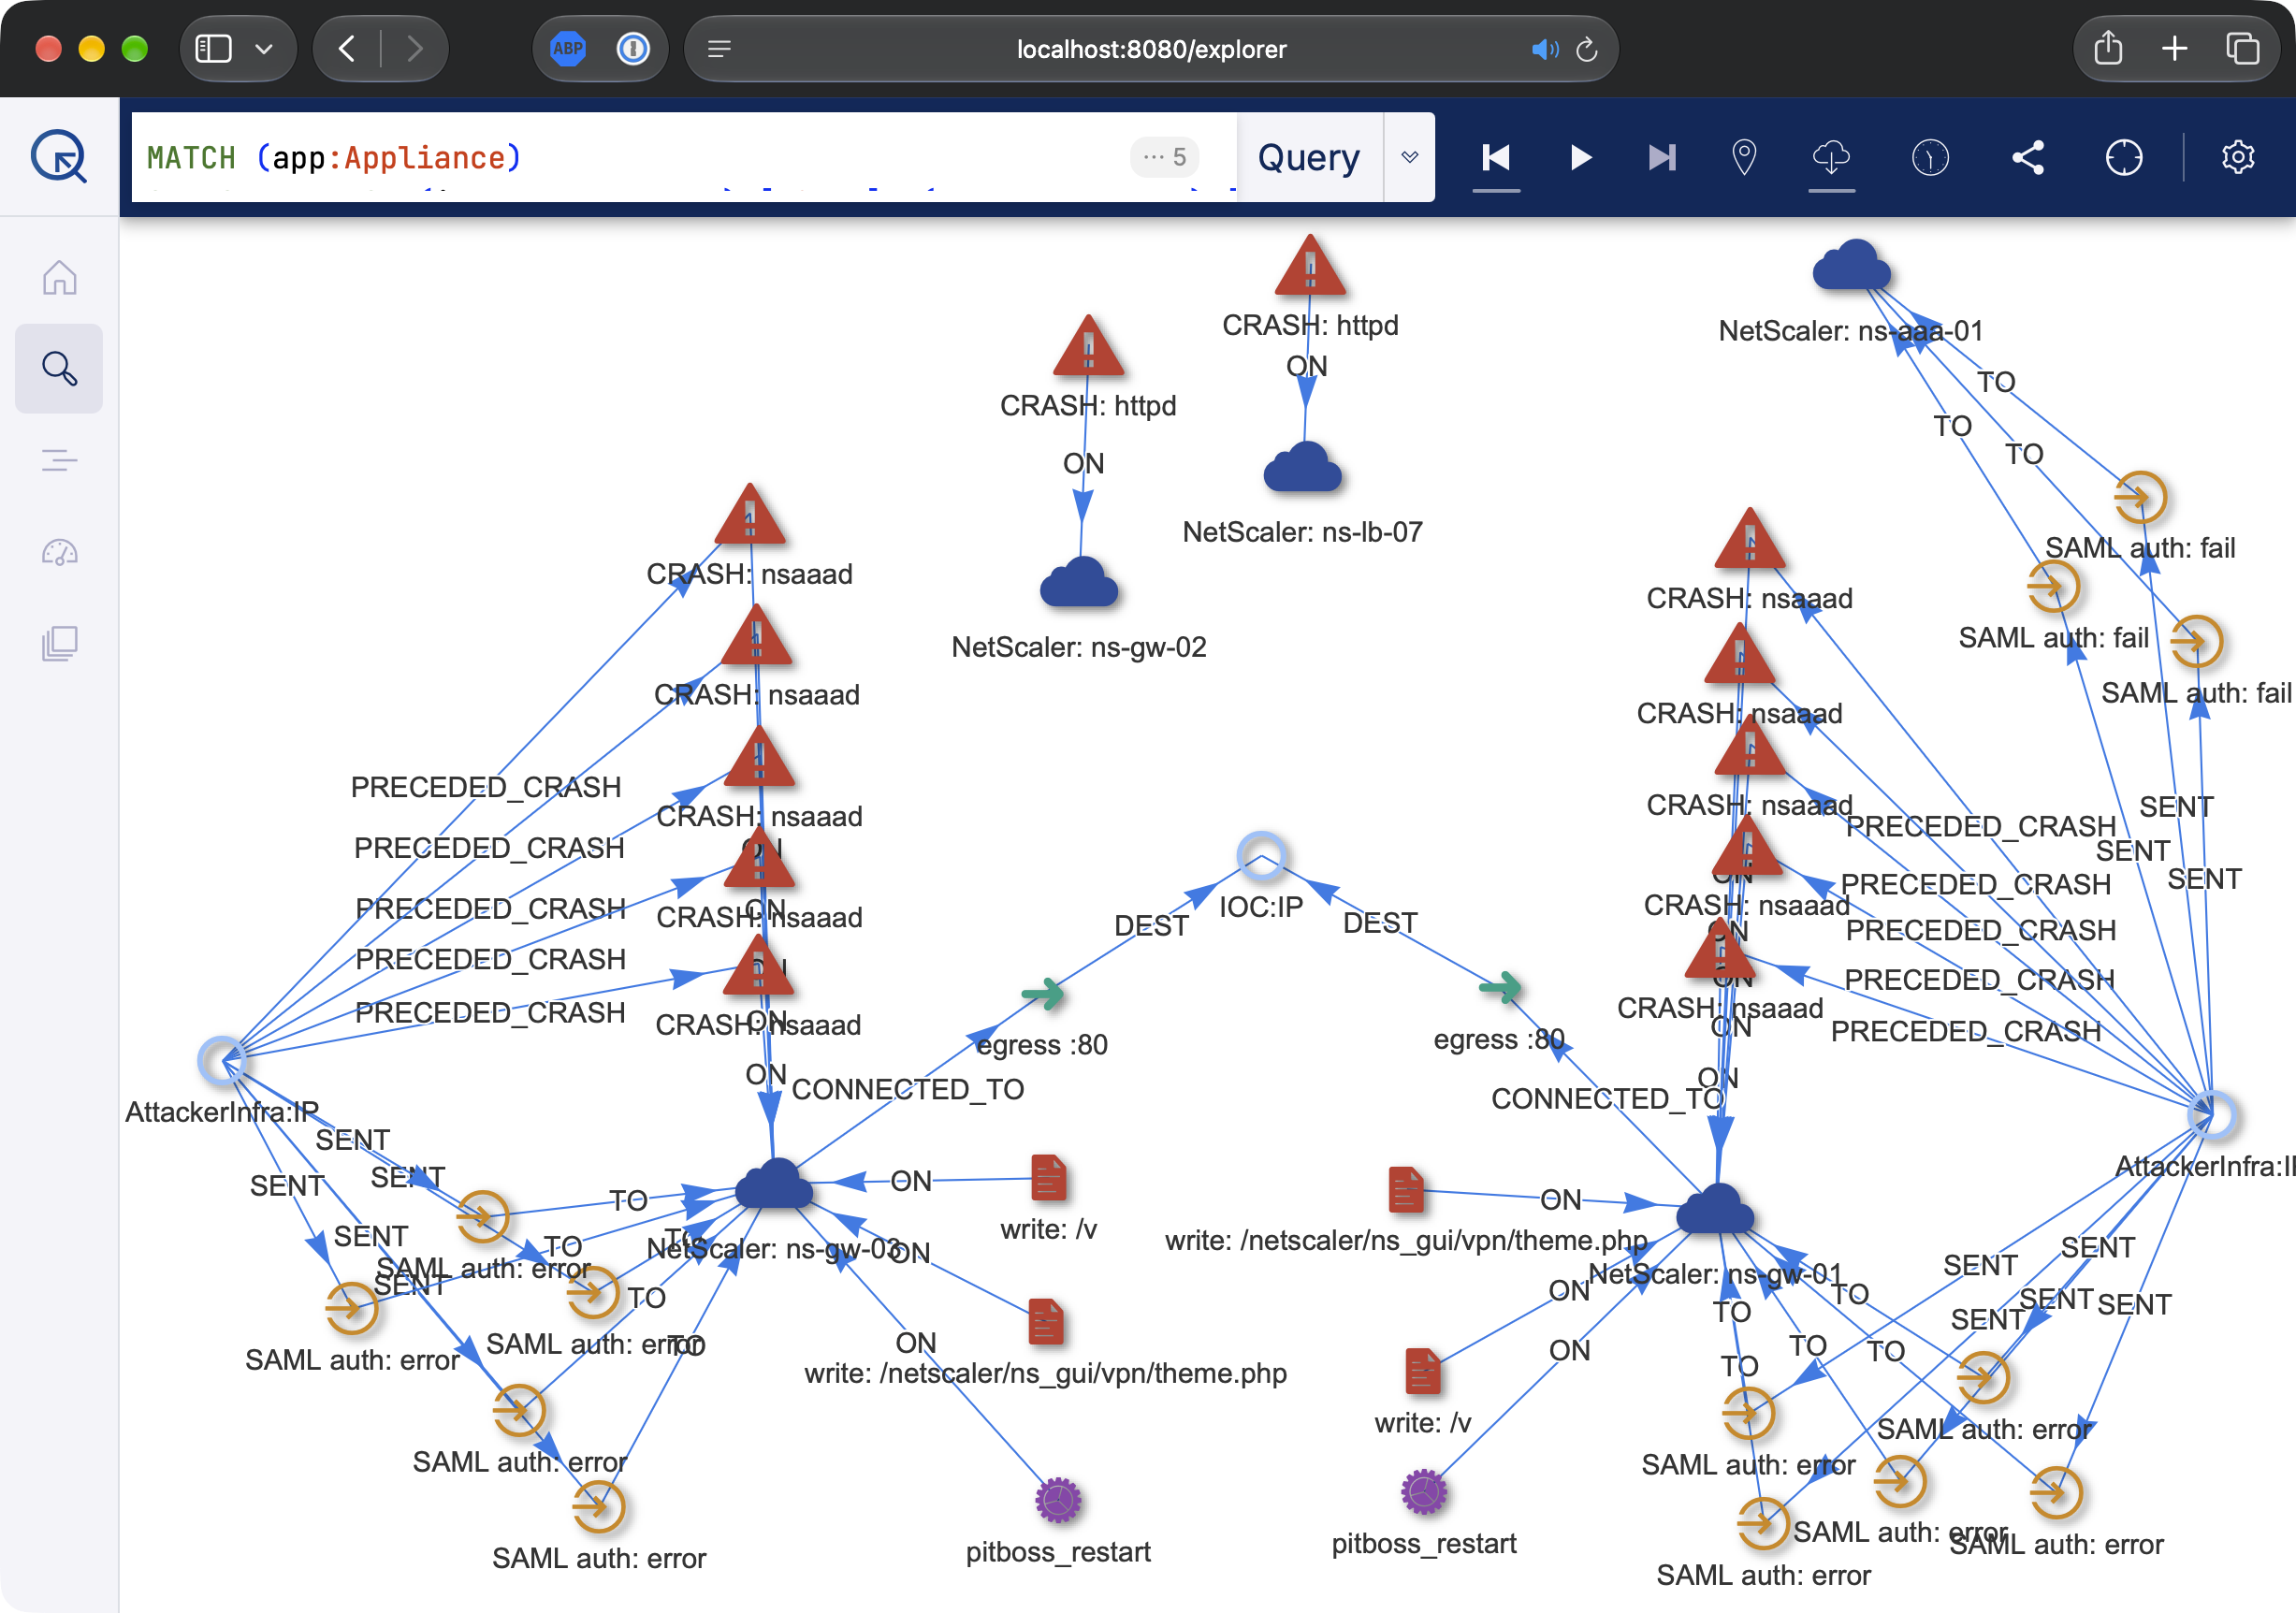 Figure 5. The estate at a glance, with all five appliances and their attack context overlaid. The two compromised gateways resolve into dense clusters, and the shared payload host ties them together.
ns-aaa-01 shows only the attacker's probes, and the two appliances with lone httpd crashes are the noise the detections ignore. The attack is a fraction of a percent of the data, and the graph structure is what makes it legible.
Run It Yourself
The complete recipe and the sample data are freely available, so you can reproduce everything above:
Note: Recipe data & instructions coming soon!
With the open source version of Quine and a Java 11+ runtime, run it with one command from the folder containing the data files:
java -jar quine-2.2.0.jar -r netscaler-cve-2026-88779.yamlAlerts stream to the console as the data ingests. Open http://localhost:8080 to explore the graph, right-click any node for the quick queries (including crashes this IP preceded and every appliance this IP touched), and paste any explore link from an alert to jump to the matched subgraph. Point the same recipe at live NetScaler authentication logs, system events, and firewall egress, and the detections run continuously against your own infrastructure. Four numbers are worth tuning to your environment: the attribution window (60 s, set it above your worst auth-log lag), the DoS window and threshold (15 min, 3), and the promotion threshold (2 crashes, 2 requests).
If you run a NetScaler fleet, patch first (14.1-73.41+, 13.1-64.28+, with the matching FIPS/NDcPP builds). Detection isn't a substitute for remediation. It is how you find out whether someone got there before you did, and whether they did more than knock the gateway over.
Want to talk through applying streaming-graph detection to your own telemetry? Get in touch and star Quine on GitHub. The standing queries here encode patterns we already knew to look for; Novelty, our streaming anomaly-scoring engine, is for the ones you don't know about yet, and it runs on the same graph.