The Problem
Monitoring systems comprised of multiple services is typically done by monitoring each service individually using it’s logs, or on an end to end basis that lacks visibility into the individual performance characteristics of each service. Root cause analysis is usually based on operations personnel instinct and past experience, making automated remediation next to impossible for many use cases.
The Solution
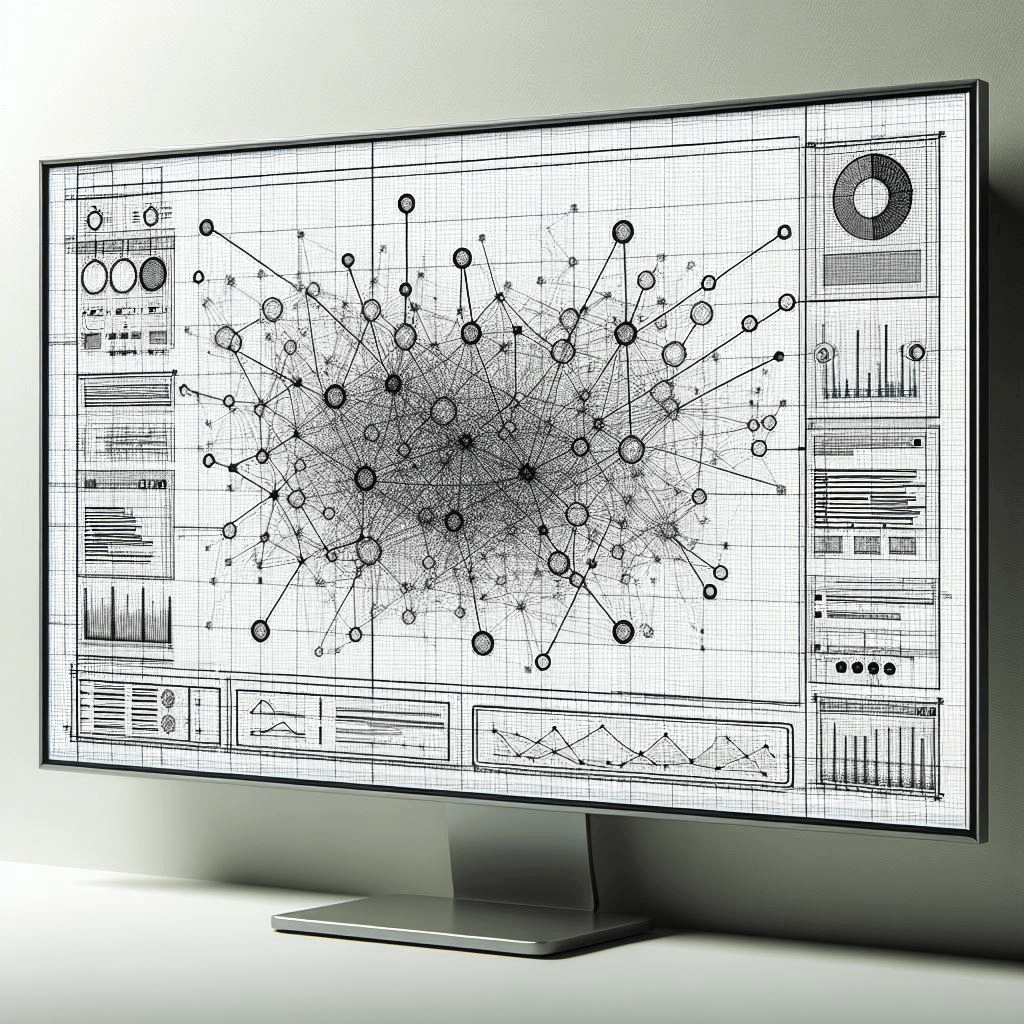
With thatDot’s streaming graph logs and events from servers, operating systems, databases, applications, and clients are ingested in real-time and assembled into a graph data model. The graph data model natively connects events with unlimited categorical classifications and calculated metrics to identify “alerts that matter” and instantly associate them to servers, VMs, containers, code versions, subnets, etc. This real-time comprehensive view of the inter-relationships between services allows rapid assessment of root causes for operations investigations or automated remediation workflows.
Key Value Take Away
- Identify issues that matter, in real-time and at scale
- Graph data modeling eliminates the complexity of deeply nested joins
- NOC technicians can easily pivot data to understand issue impacts and root causes
- Automatic handling of out-of-order data arrival
- Entity resolution between log and event sources
- Integrates with existing Apache Kafka, AWS Kinesis, data lake, and API event sources