The thatDot team had a great time last week at Confluent’s big conference, Current 2024. We talked to a lot of folks about the power of Streaming Graph, an event stream processor with a graph data model.
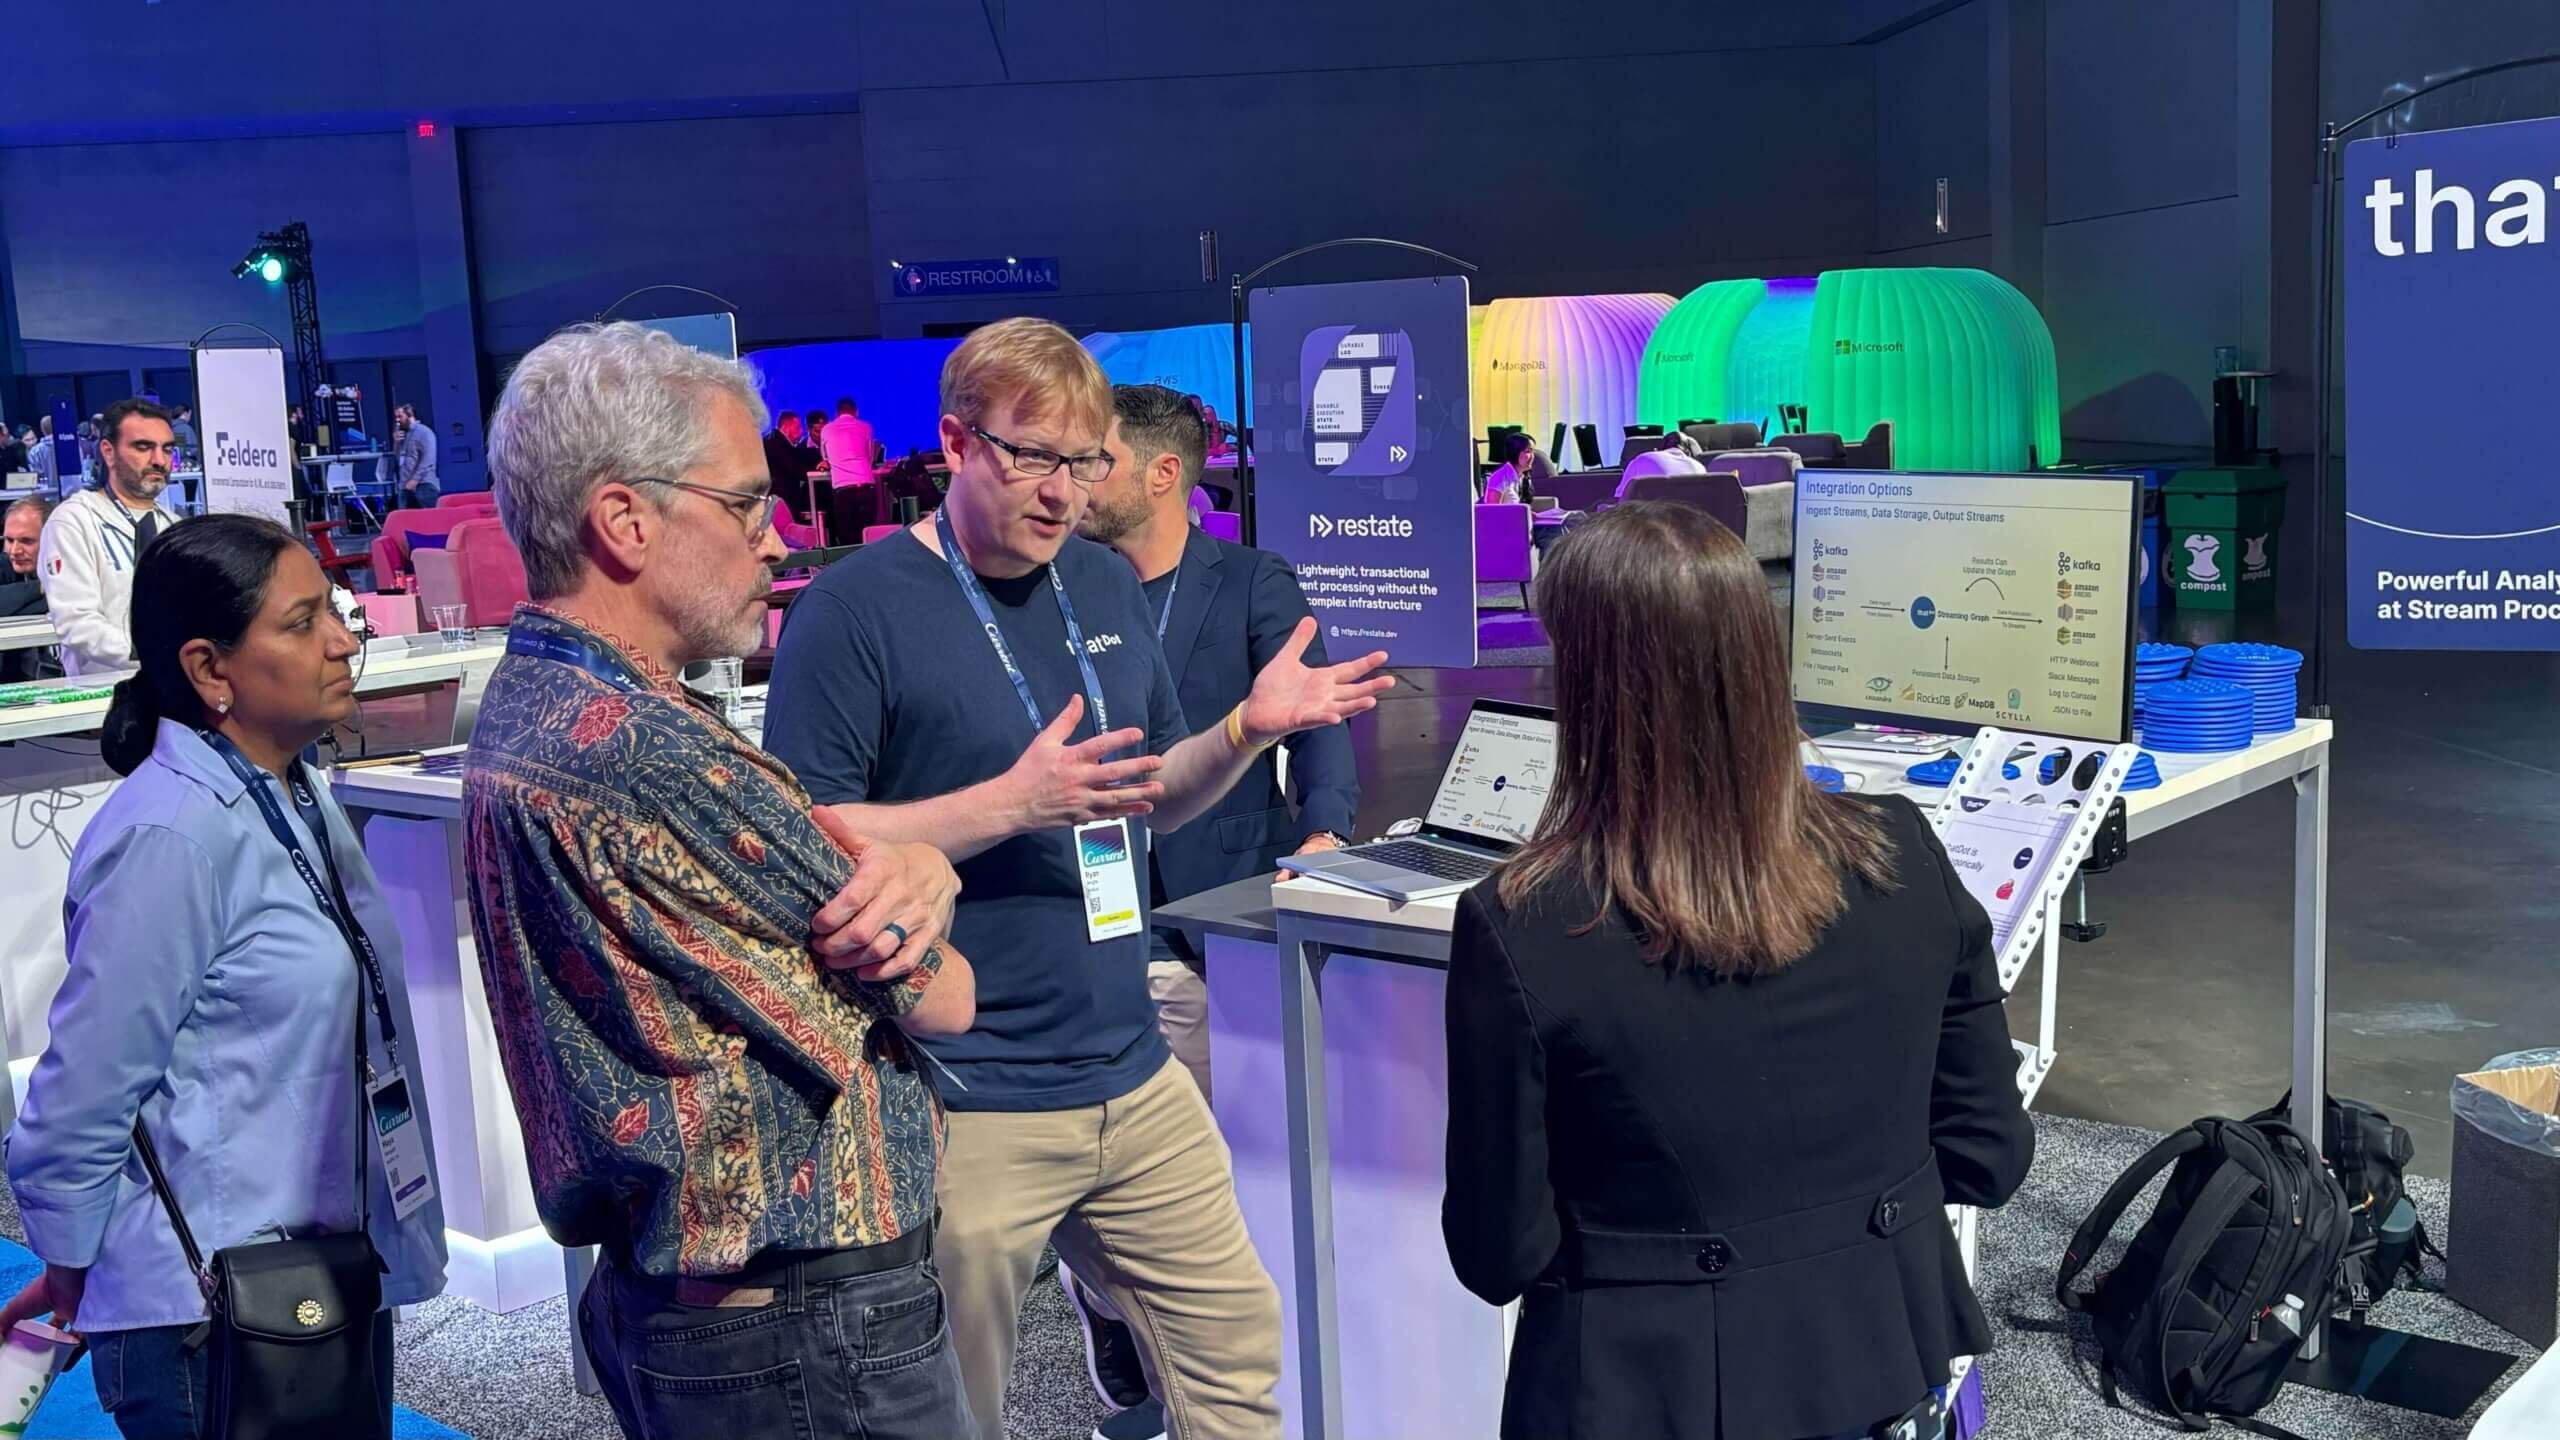
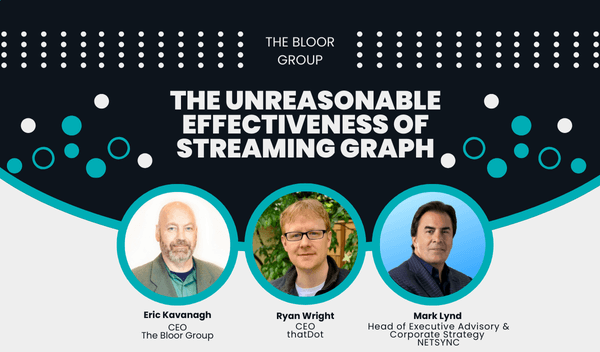
Event Driven Architecture
Streaming Graph for Real-Time Risk Analysis at Data Connect in Columbus 2024
After more than 25 years in the data management and analysis industry, I had a brand new experience. I attended a technical conference. No, that wasn’t the new thing. At many conferences, I’ve been surrounded by data scientists, business analysts, data engineers, mathematicians, developers, startup founders, CTO’s, architects, and PHD students, made network connections, listened to giants in the field, like the Chief of Information Management of the United Nations at this one. But, uniquely,...
Cypher all the things!
Uses for individual data engineering technologies are often broadened to more than just interacting with databases. The same goes for graph database techniques and, specifically, the leading language for building and querying graph databases – Cypher.
thatDot CEO Explains Streaming Graph to Cybersecurity Thought Leader
Briefing Room on demand webinar on thatDot Youtube channel: The Unreasonable Effectiveness of Streaming Graph thatDot founder and CEO Ryan Wright discussed the power of thatDot Streaming Graph and Novelty to detect the most well-hidden threats with the Bloor Group's Eric Kavenagh and Mark Lynd, who was ranked #1 global thought leader in cybersecurity by Thinkers360. With high-profile data breaches hitting the headlines every other day now, the way we're doing this is clearly a losing battle....
Microservice Hell: The State of the Art in Streaming Services
Exploring the challenges of data processing in microservices, the article introduces thatDot’s Streaming Graph, which seamlessly integrates various data sources like Apache Kafka, AWS Kinesis, and more.
Can Streaming Graphs Clean Up the Data Pipeline Mess?
In this article on Datanami, Alex Woodie discusses the problems with current event stream processing data pipelines, and the advantages a graph paradigm could bring to the table, with thatDot technology spotlighted. He talks about how thatDot's Ryan Wright found himself having to rebuild the data pipeline infrastructure of multiple times, and how brittle and difficult to maintain it could be. “The more data pipelines you build, the more they start looking like the same thing,” Wright says....
ThatDot accelerates streaming data analytics with open source Quine
On VentureBeat, Shubham Sharma writes about thatDot's announcement of open source software Quine for streaming graph complex event processing. He discusses, among other things, the power of Quine to reduce the burden on developers of event stream processing data pipelines. "It can eliminate batch processing, multi-level joins, and other time-consuming and outdated processes that drag down and stall analysis on streaming data. This way, data pipeline engineering teams can easily interpret...
thatDot launches Quine, a streaming graph engine
On TechCrunch.com, Frederic Lardinois talks about the launch of Quine open source streaming graph complex event processing engine. “We’ve developed the streaming graph to really target the kind of the problem in the industry right now — the rock and hard place that we all sit between,” Quine’s creator and thatDot CEO and co-founder Ryan Wright told me. “On one side, there’s huge volumes of data. For the last 10 years, big data has just become de rigueur, it’s a normal ordinary thing...
Calculate Risk and Optimize Asset Allocation in Real Time
Asset allocation and risk calculations need to move from batch to real time to free assets and improve compliance. Quine Streaming Graph provides a path.
Using Indicators of Behavior (IoB) Analysis for IoT data
Indicator of Behavior (IoB) analysis is extending beyond the cybersecurity domain to offer new value for finance, ecommerce, and especially IoT use cases.
Quine’s Real-time Temporal Event Sequencing Produces New Insights
Quine’s standing queries, idFrom + deterministic labelling can be use to efficiently create any subgraph you need (e.g. sequence based) in real time. This makes alerts more timely and root cause analysis more efficient.
Why Digital Twins Need to Go Real Time
For digital twins to be truly useful in business operations, they must be able to drive actions and do so the instant an issue emerges, perhaps even beforehand.
See Quine in Action: 3 Live Demos Showing Graph ETL Use Cases
Watch Quine in action. Learn about graph ETL uses cases from three recent live demos.
Kafka data deduping made easy using Quine’s idFrom function
Learn how easy it is to use Quine streaming graph’s idFrom function to deduplicate Kafka (or any other) event streams.
Ingest How-To: Real-time Graph Analytics for Kafka Streams with Quine
Blog #5 in the Ingesting Data series. A step-by-step guide to adding Quine’s high-volume graph analytics inline with your Kafka-based event streams.
Ingest and Analyze Log Files Using Streaming Graph
This blog shows you how Quine streaming graph can ingest multiple log formats to create a single, unified streaming graph for real-time analysis.
Ingesting From Multiple Data Sources into Quine Streaming Graph
Ingest multiple data sources into Quine in order create a single streaming graph. ETL basics and Cypher queries are covered.
The Evolution To Streaming Graph from Graph Databases
When it comes to event-driven applications, graph database users require a new approach: streaming graph.
Quine Streaming Graph Scales to 1.1 Trillion Log Events per Month
Learn how Quine streaming graph achieved a sustained rate of recording 425,000 records per second into our streaming graph.