

Understand Your Graph at a Glance
Quine 2.1.0 is here, and the visual Quine experience just took its biggest leap yet. The web interface now brings your streaming graph to life, upgrading the tools you already use and introducing new ones to observe it.
A live view of your running system
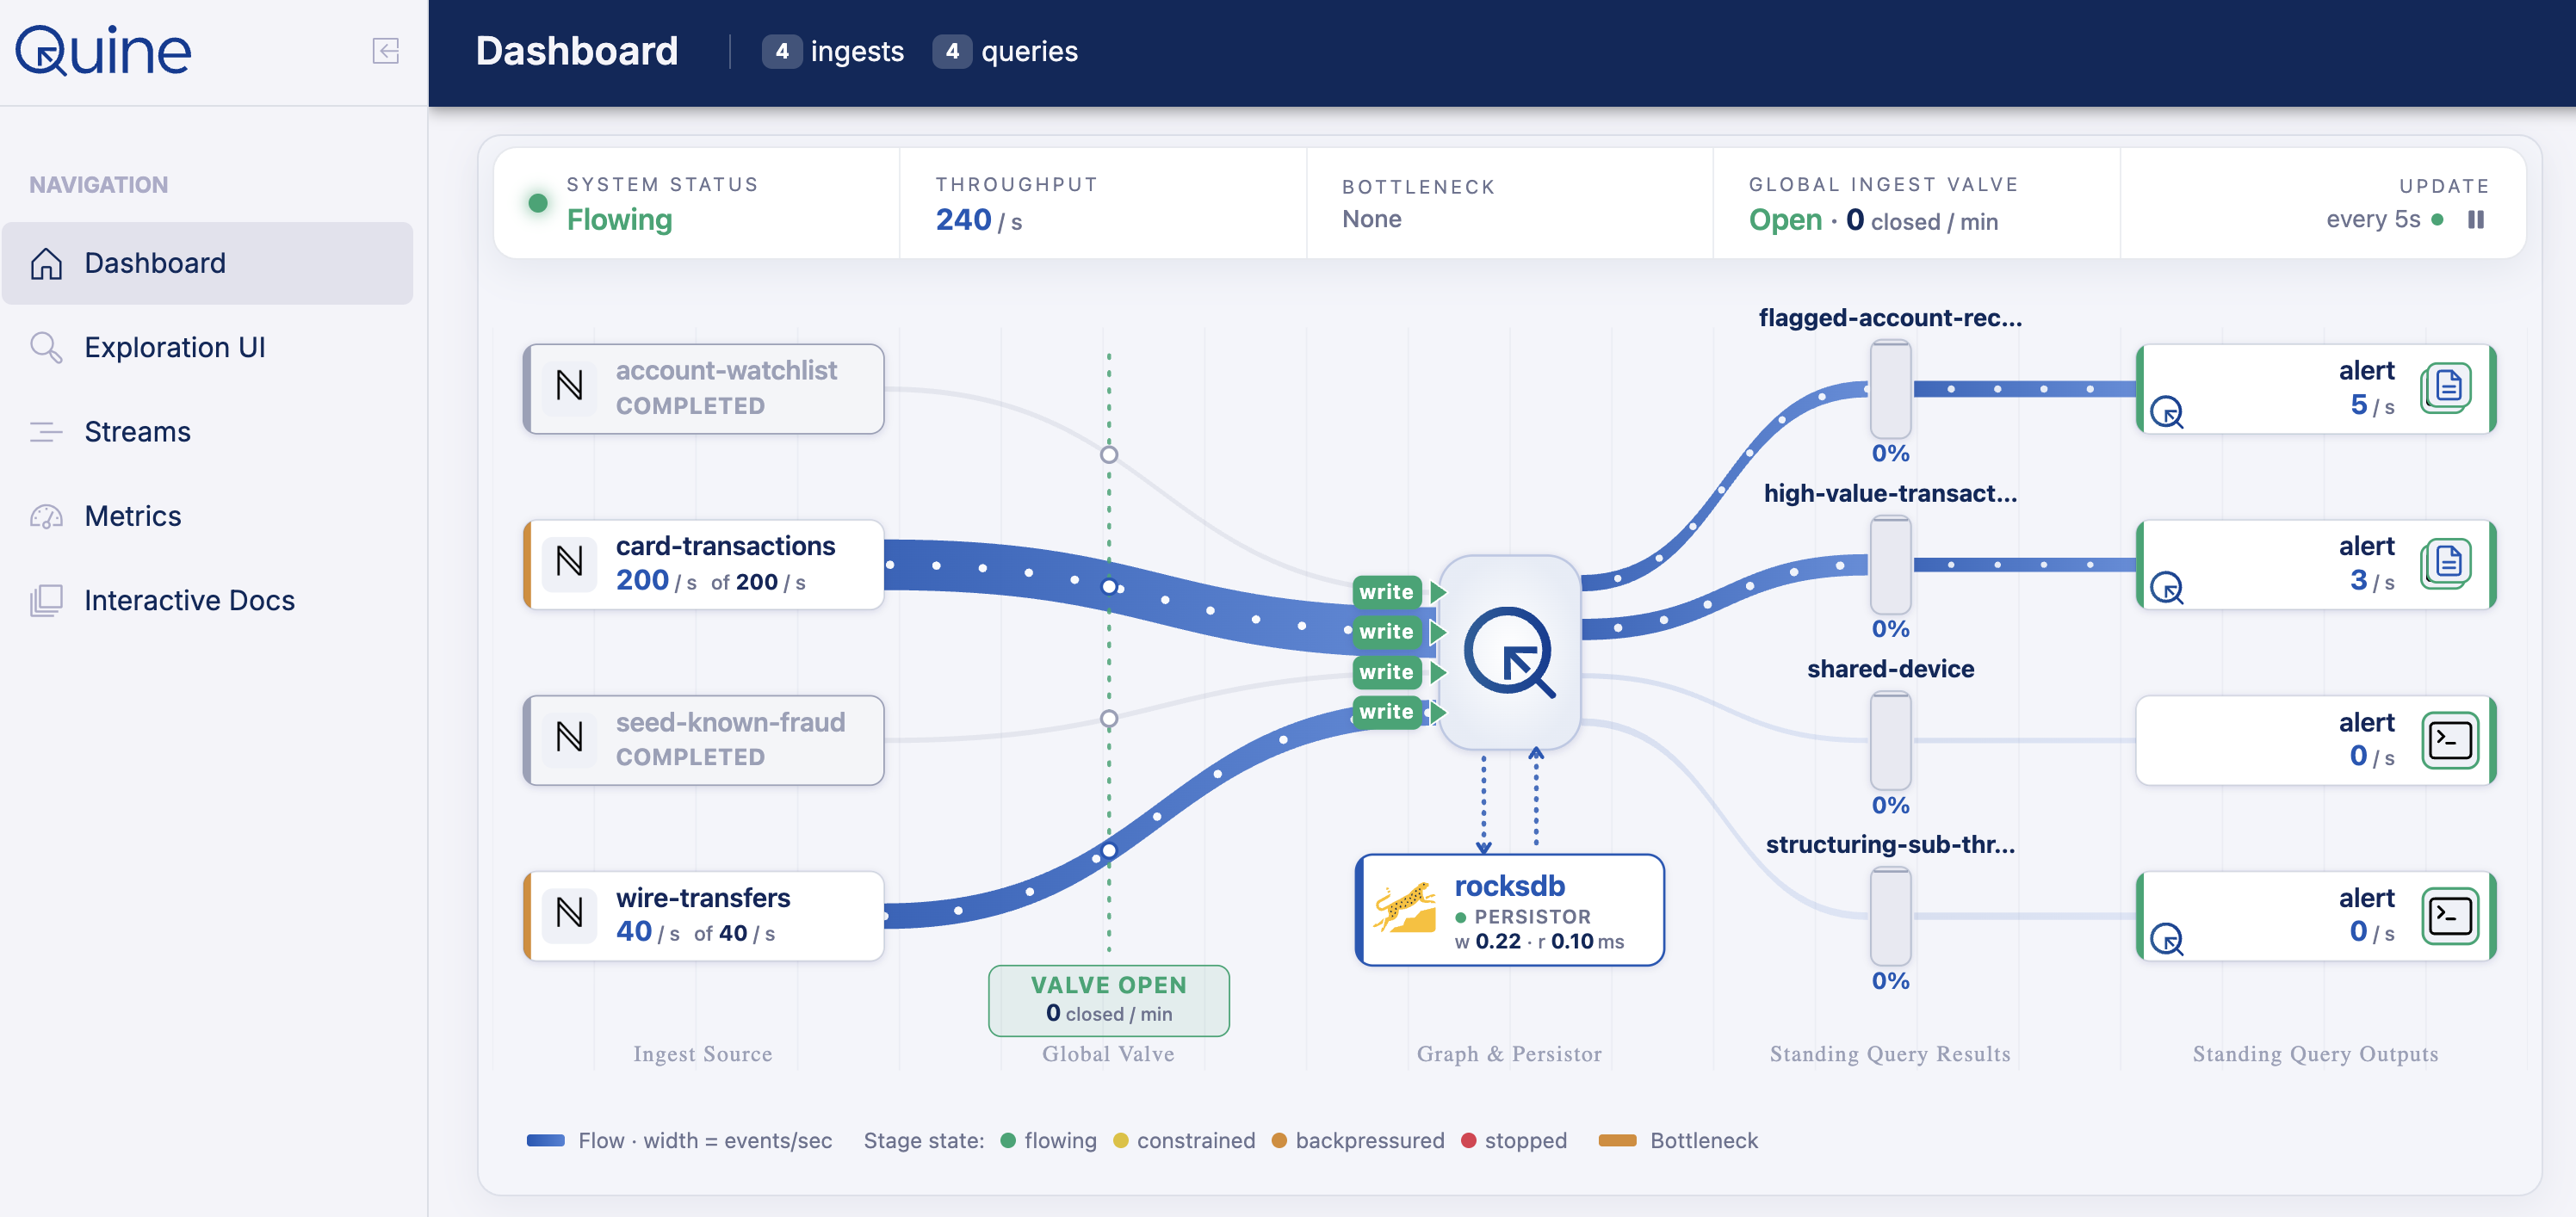
Your Quine instance as one live flow diagram, ingests on the left, standing-query outputs on the right, each stage colored by what it is doing right now.
This is the screen you will want to keep open all day. The home dashboard draws your whole instance as a single live flow diagram, tracing data from ingests, into the graph, round-trip to the persistor, on to your standing queries, and out to your destinations. Each stage is sized by its throughput and color-coded by backpressure, so you can tell whether a component is flowing normally, paused, failed, or backpressured. Hovering any stage brings up its precise measurements and counts so you can pinpoint exact values for each component.
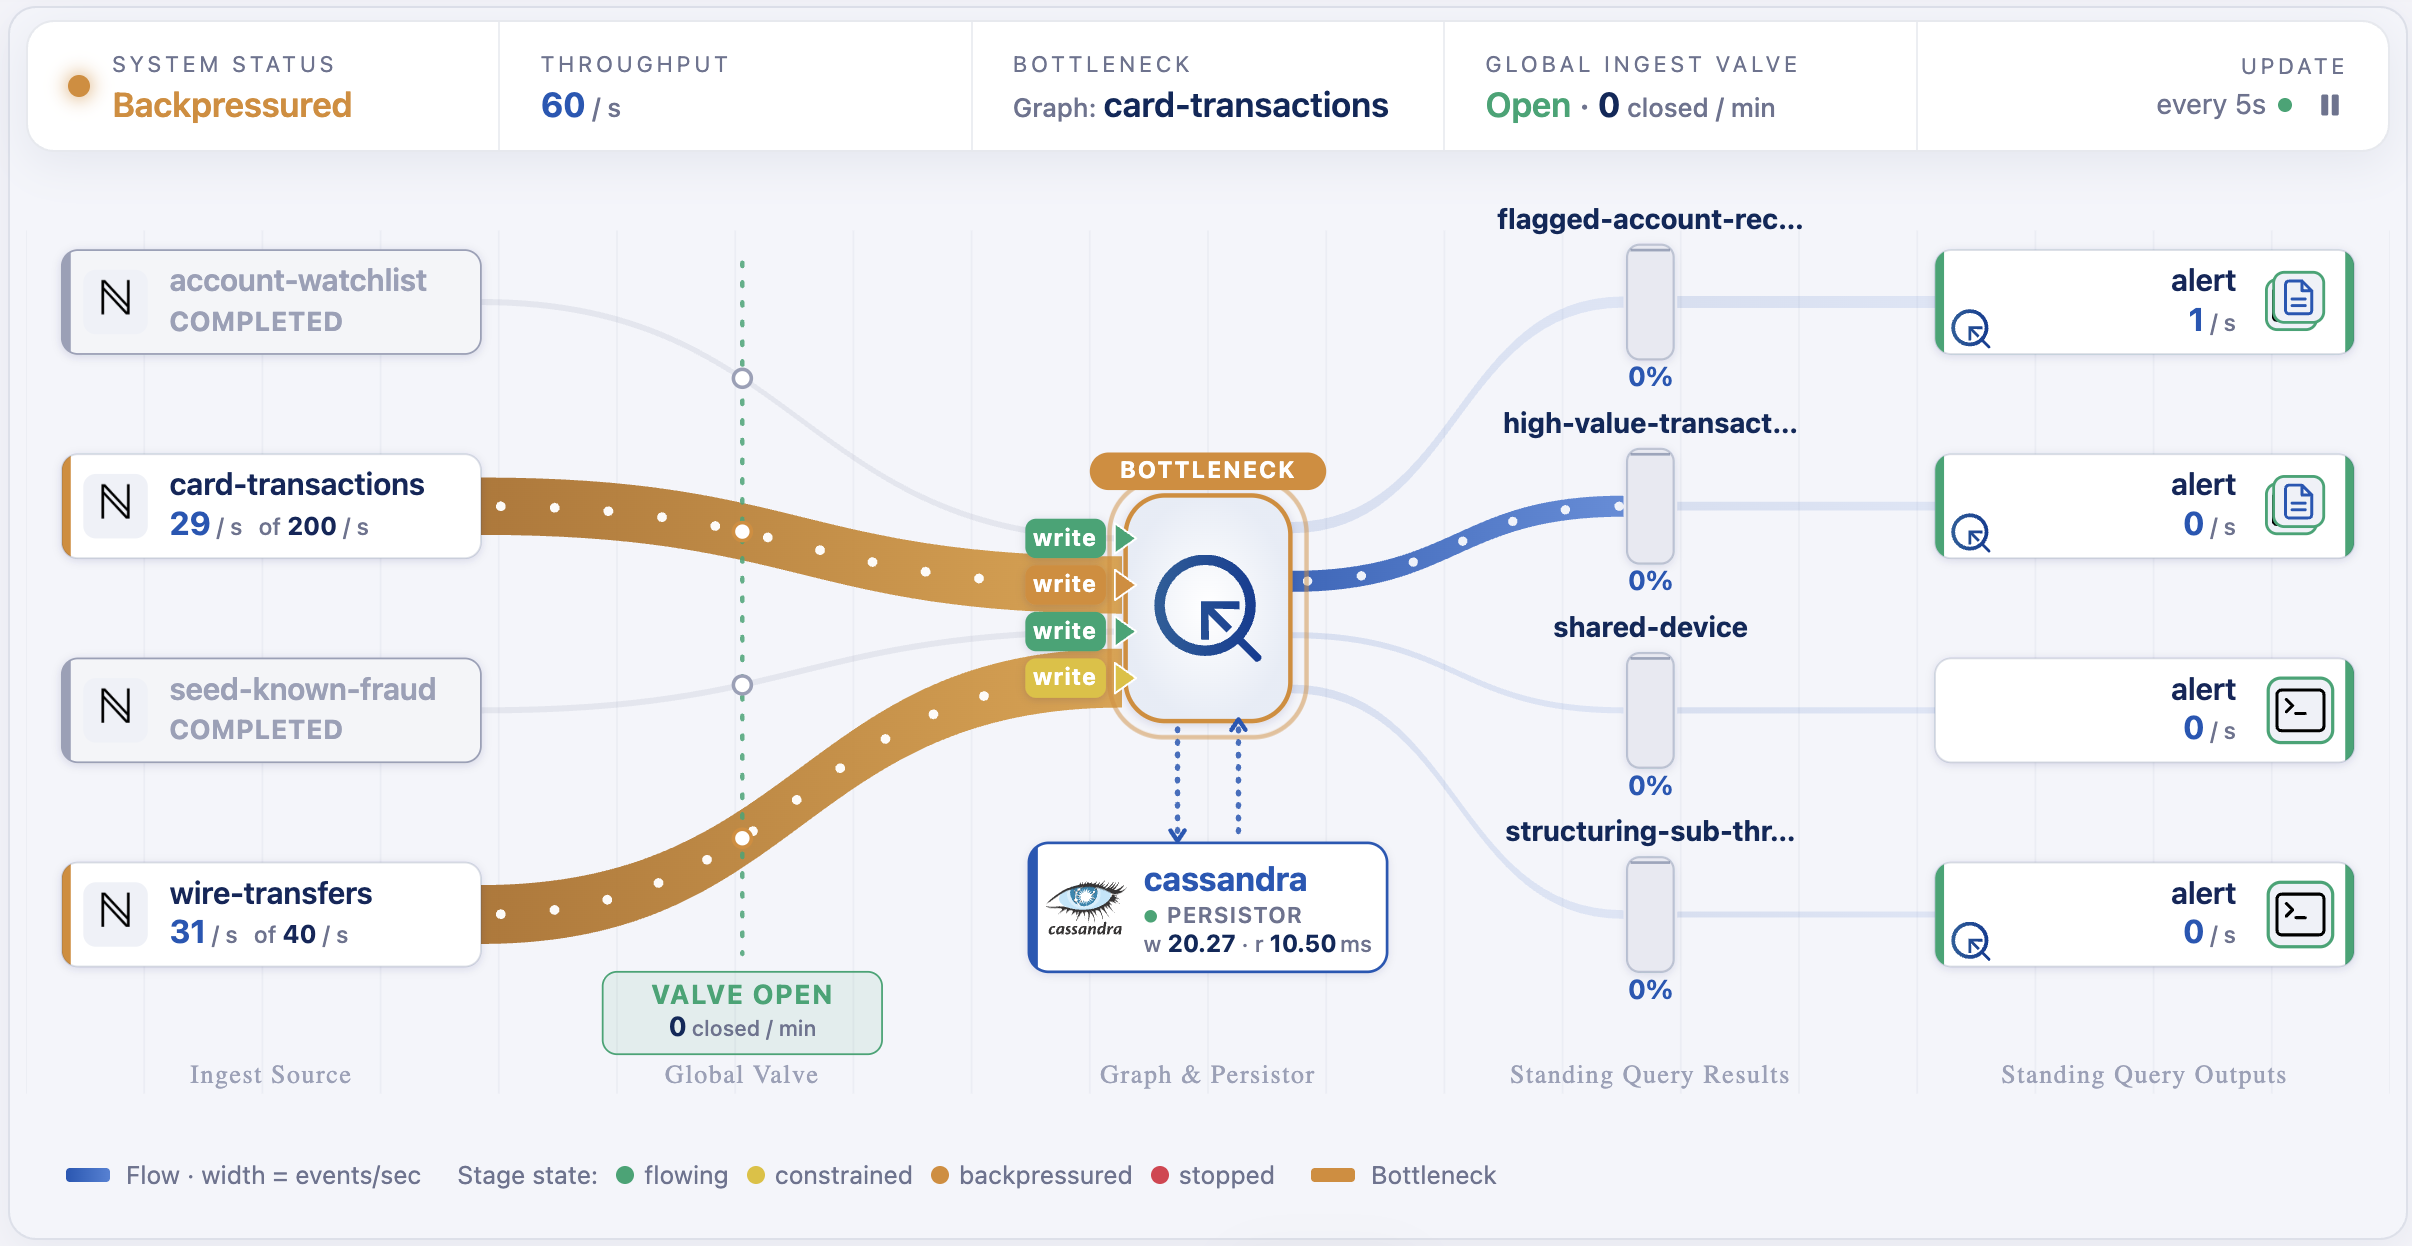
When a stage can't keep up, the flows feeding it turn amber and the bottleneck is highlighted, so you can see where backpressure is building and take action.
Backpressure is what keeps Quine stable and flowing, but it can make it challenging to understand which steps should be taken to improve throughput. If your Quine instance doesn't run as fast as you'd like, you can now see an instant diagnosis to point at which component is the bottleneck. Data flows are colored by their backpressure status, so you can instantly recognize which components are limiting the overall system and adjust them accordingly.
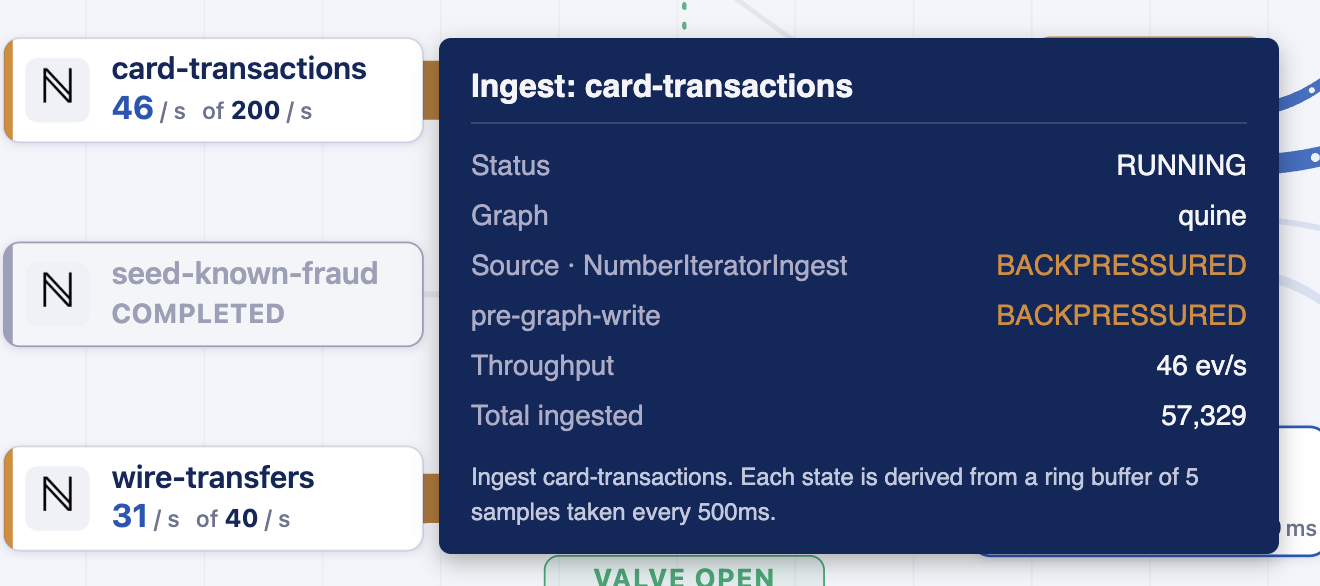
Hover any stage for its exact throughput and state; a backpressured component turns amber and shows where the pressure is building.
Manage your streams
The Streams page is where you create and manage both ingest streams and standing queries, directly in the UI. Each one shows its current status, and you can expand any stream to see its full configuration alongside its live metrics, so building a pipeline, adjusting it, and watching how it behaves all happen in the same place.
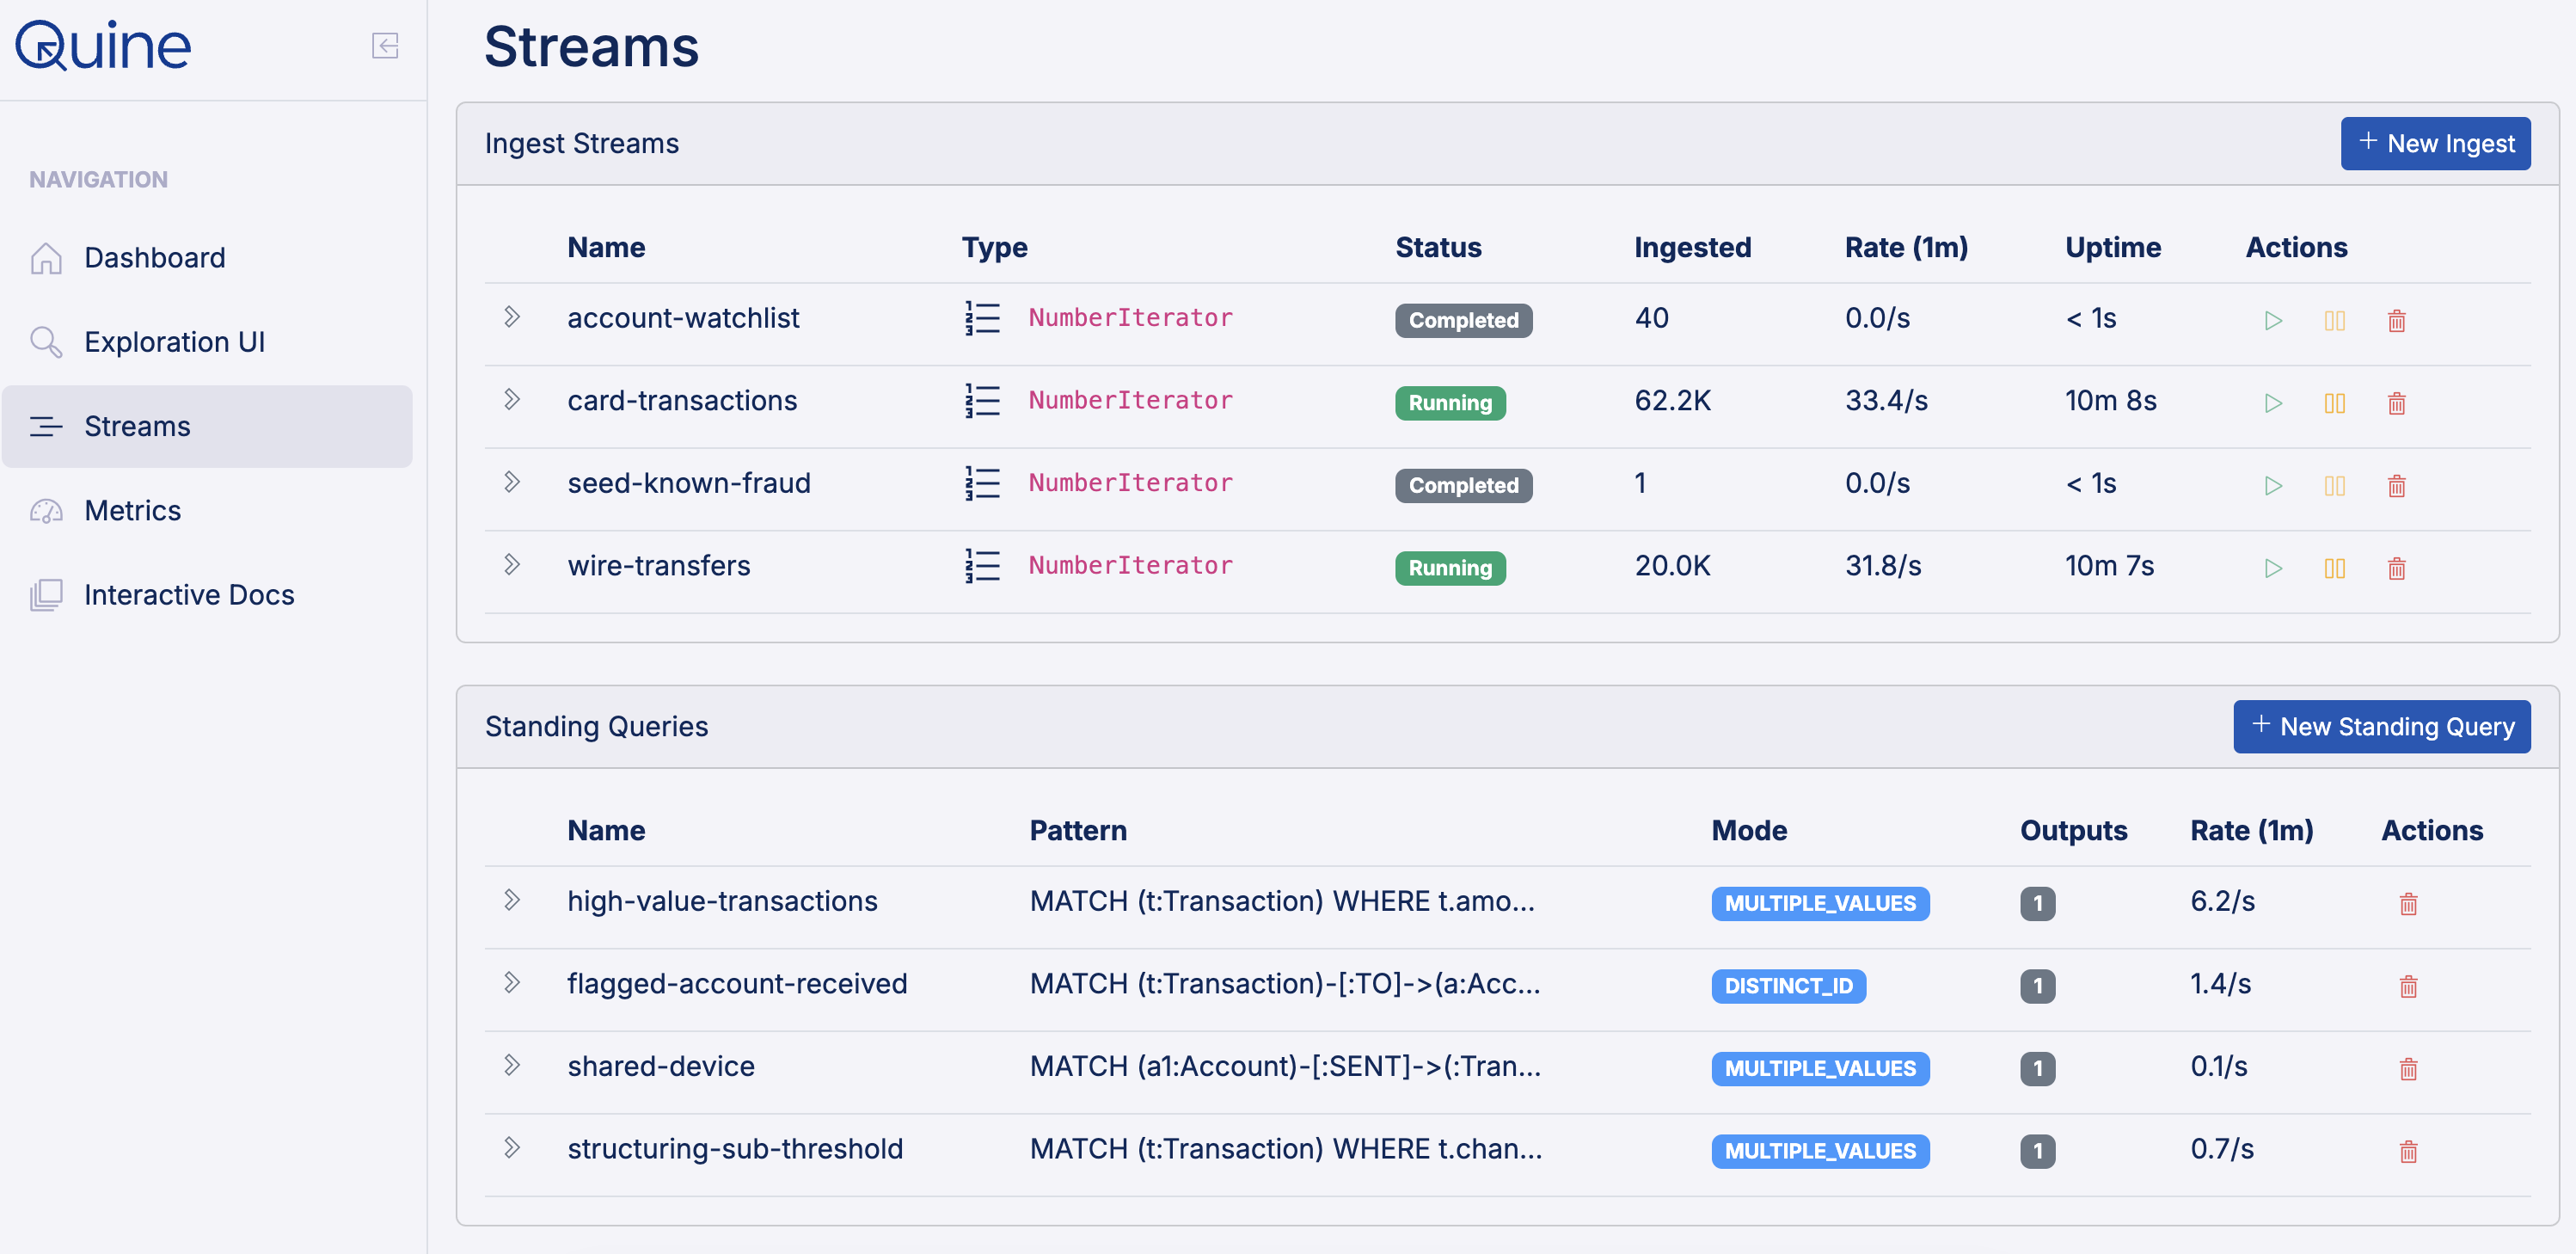
Create and manage every ingest and standing query from one page, each with its live status and rate.
Exploring your graph
Exploring your data starts with the Cypher editor, a multi-line workspace with syntax highlighting, autocomplete, inline documentation, and inline diagnostics, letting you read a long query comfortably and catch problems as you type, and it will stop you before running a query with an obvious syntax error. The Query button beside it opens a dropdown of optional capabilities.

A multi-line, syntax-highlighted editor, with the Query button's menu for running the query, bookmarking it, or tapping a standing query.
Query results now open in their own floating cards. You can expand a card into a resizable viewer or tuck it into a compact stack in the corner, and because each result is independent, you can keep several open at once to compare them and rerun any of them on its own.
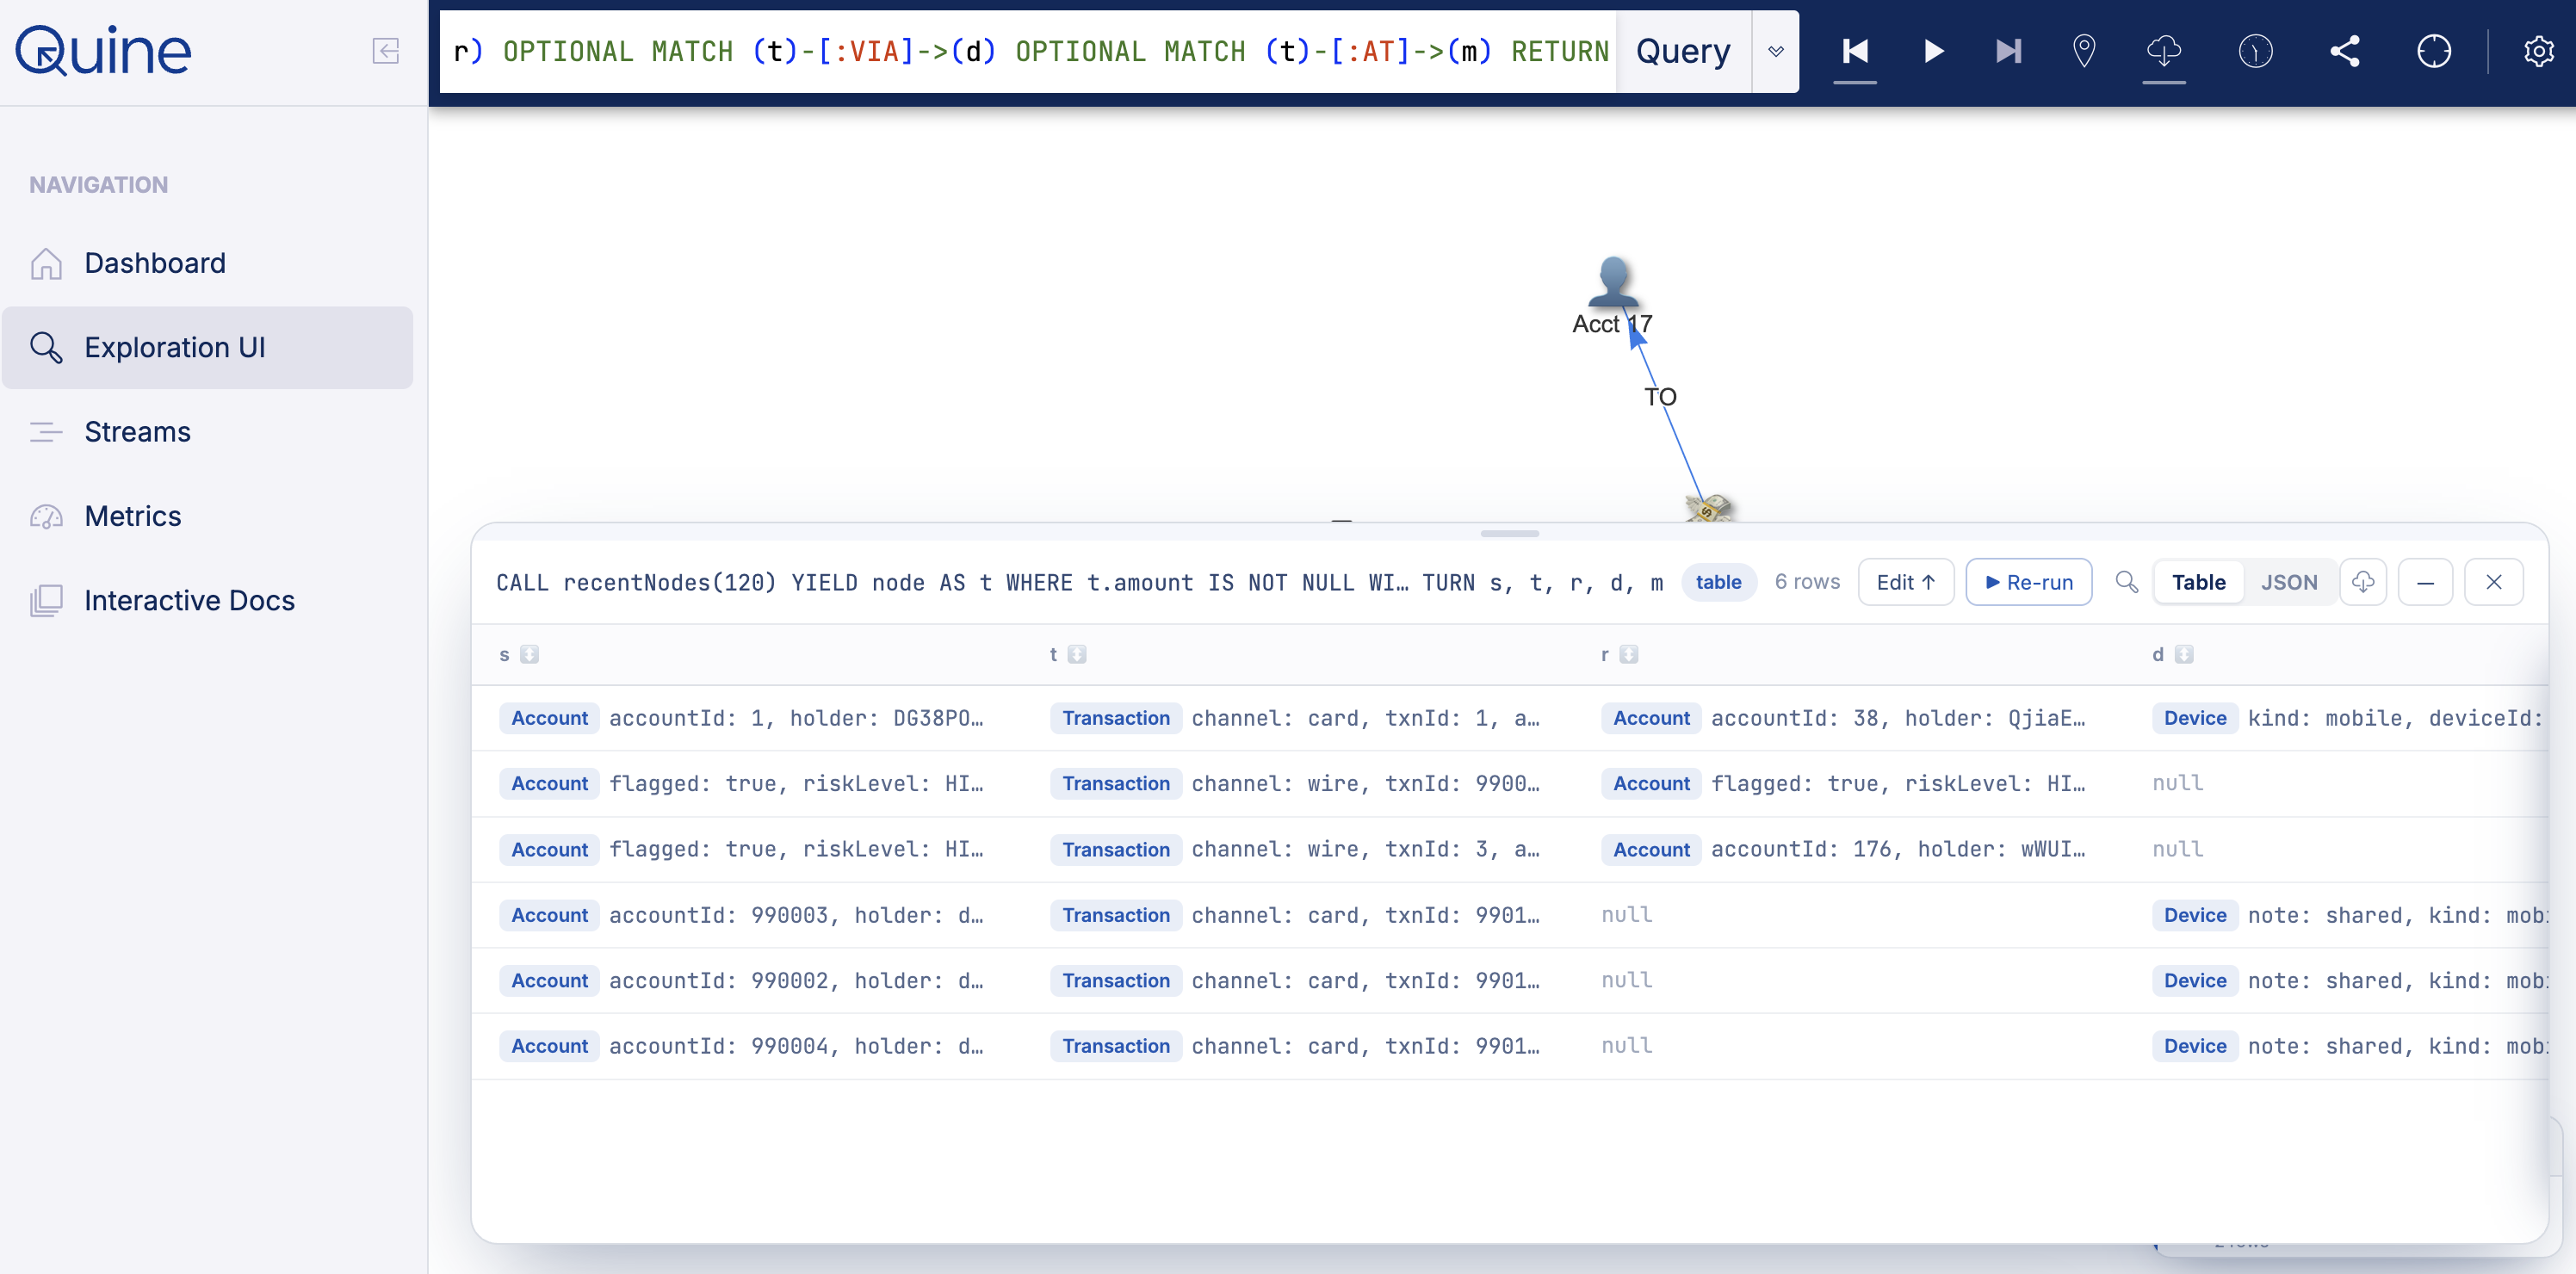
Query results land in a floating card you can expand over the graph, page through, and re-run on its own.
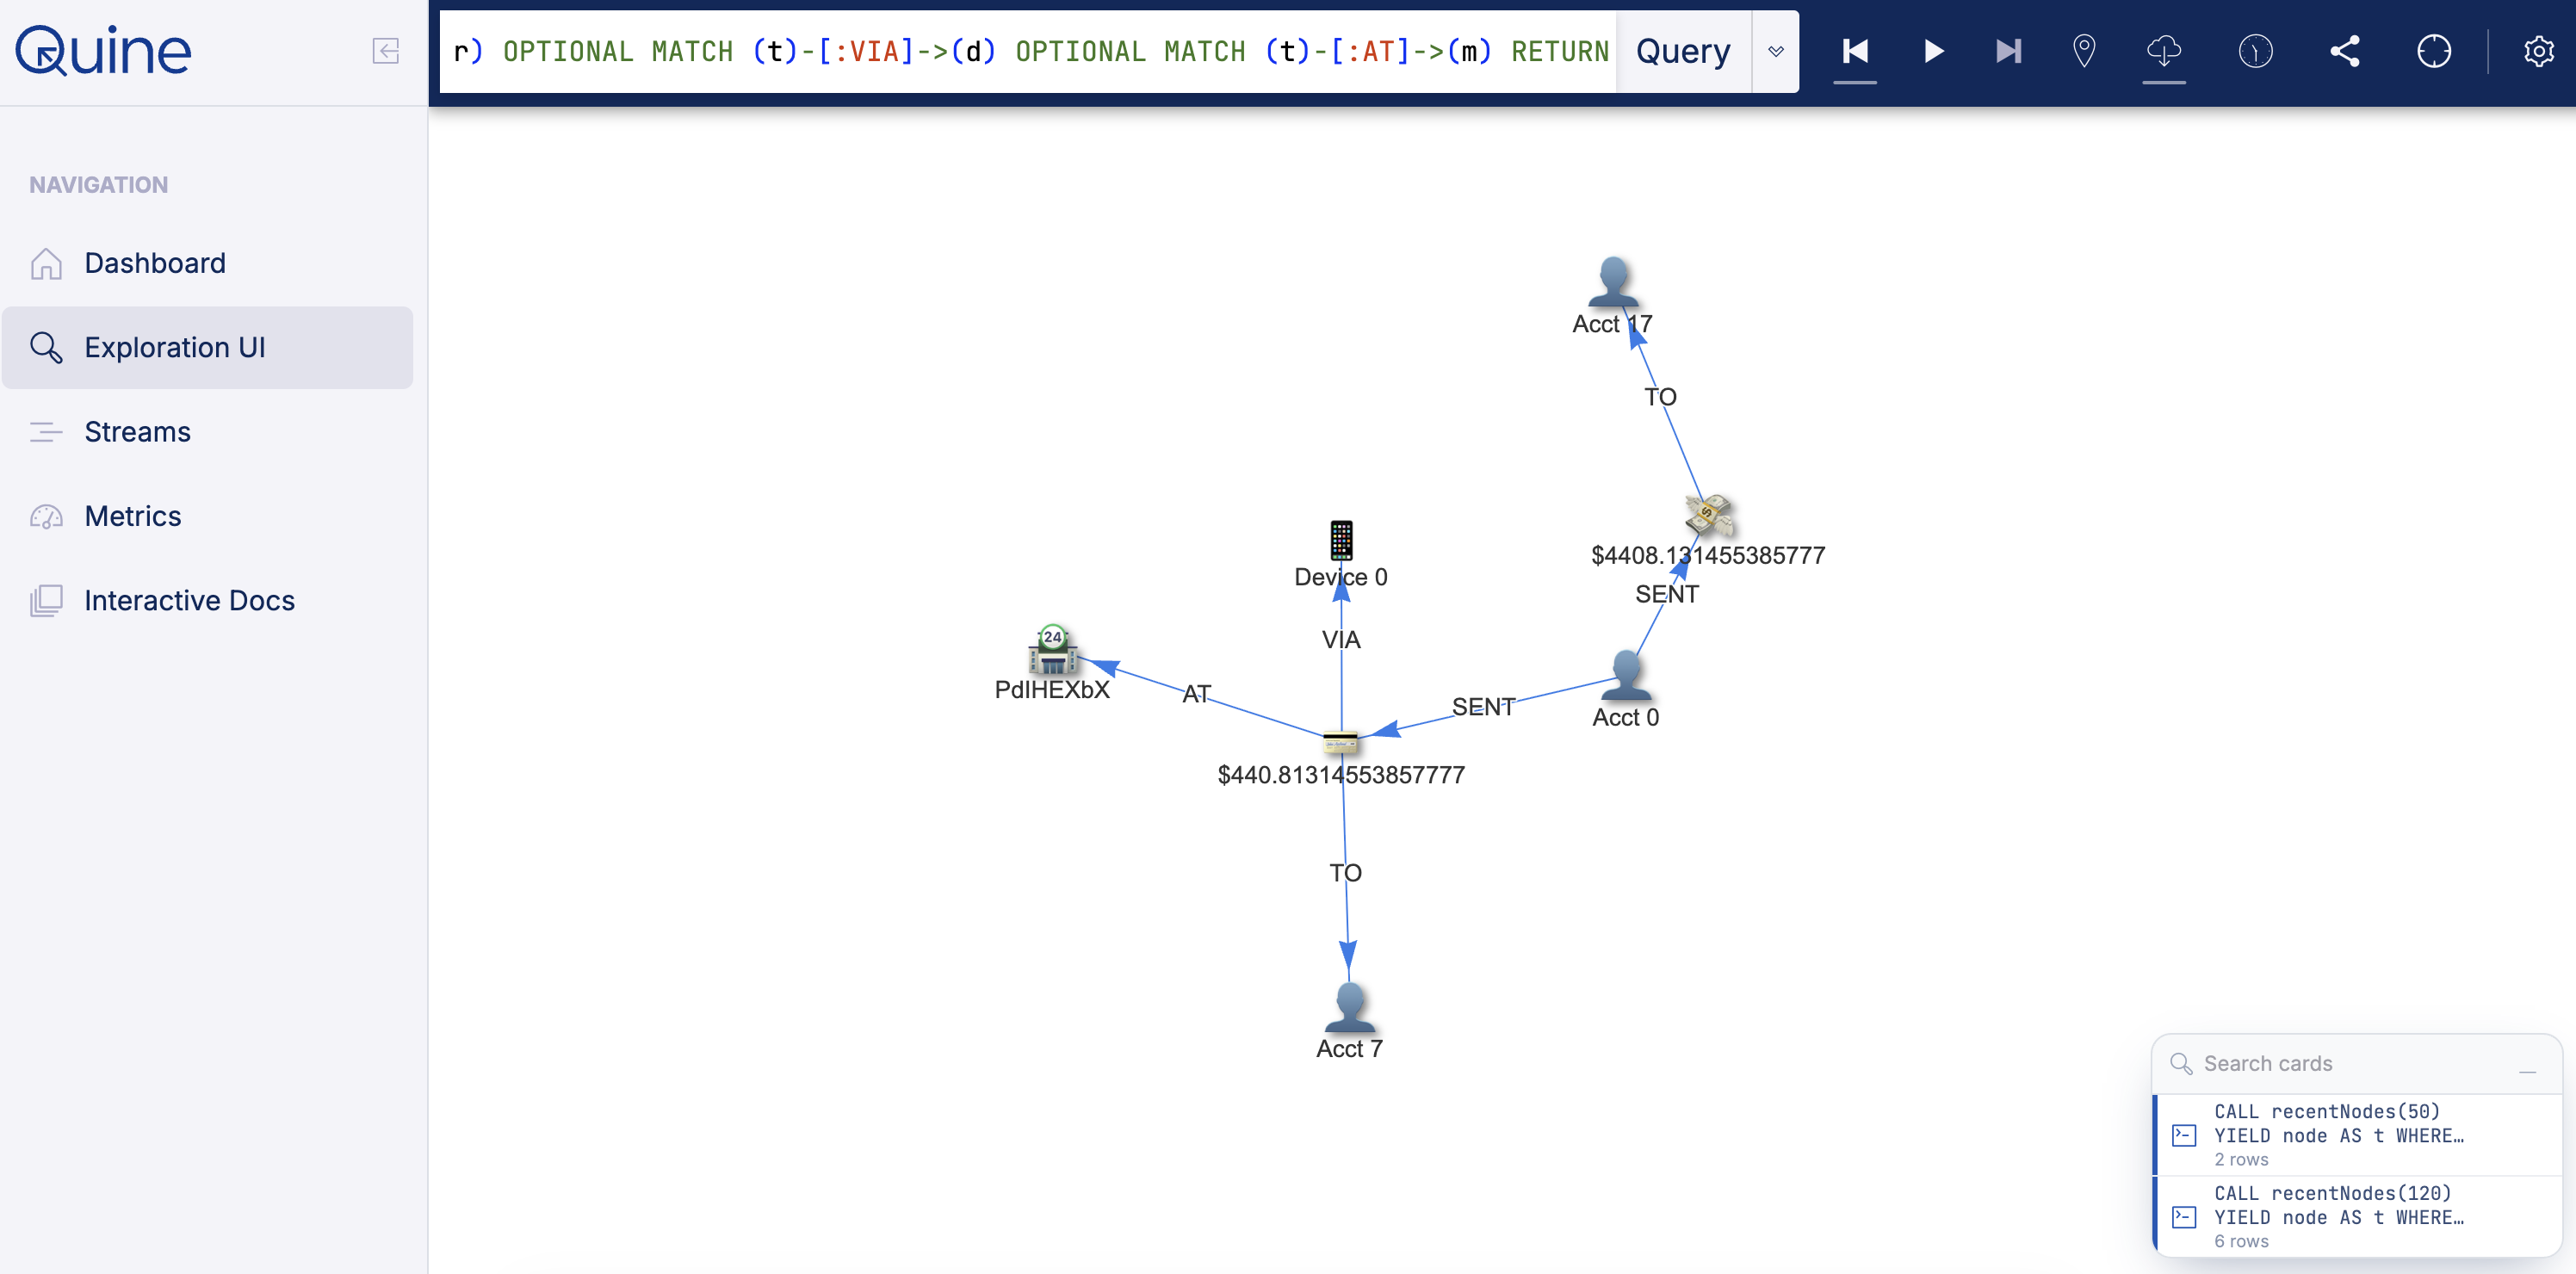
Or tuck cards into a compact stack in the corner and keep several open at once, with the graph front and center.
A handful of smaller touches round out the page. A node properties viewer lets you inspect and edit a single node's properties directly without writing a query, nodes stay put where you drag them until a Shift+click-hold releases them, and node and edge counts appear briefly over the canvas after each query. Exploration UI Settings gather the rest into one place, where you can manage sample queries, define quick queries for one-click actions on nodes, customize how different node types appear, and bookmark the queries you run most.
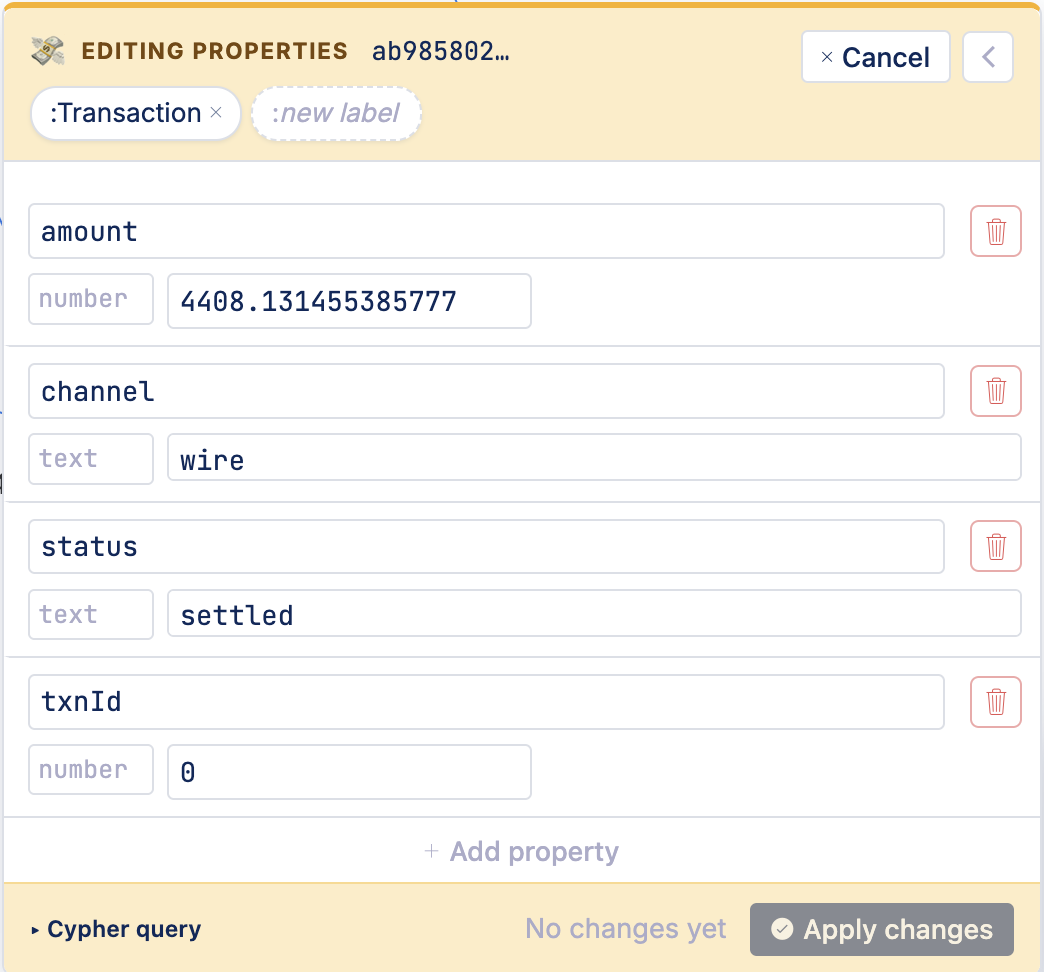
Inspect and edit a single node's properties inline, no query required.
See live standing-query outputs
The surest way to confirm that a standing query is doing what you want is to watch it work, and now you can, right in the UI. Tap right into a running standing query and its results stream out live as they are produced, without writing a query to catch them. Standing query inspections, available via the query dropdown, let you inspect several points along the output workflow: at the raw standing query result, after transformation, and just before results fan out to your destinations. So you can see exactly how a standing query result mutates across output stages and inspect visually how each step shaped the result.
With "graph feeds", available on the exploration settings menu, you can set up a standing query to send live updates right into the Exploration UI canvas as new results stream in, turning the canvas into a live view of what the standing query is matching in the moment.
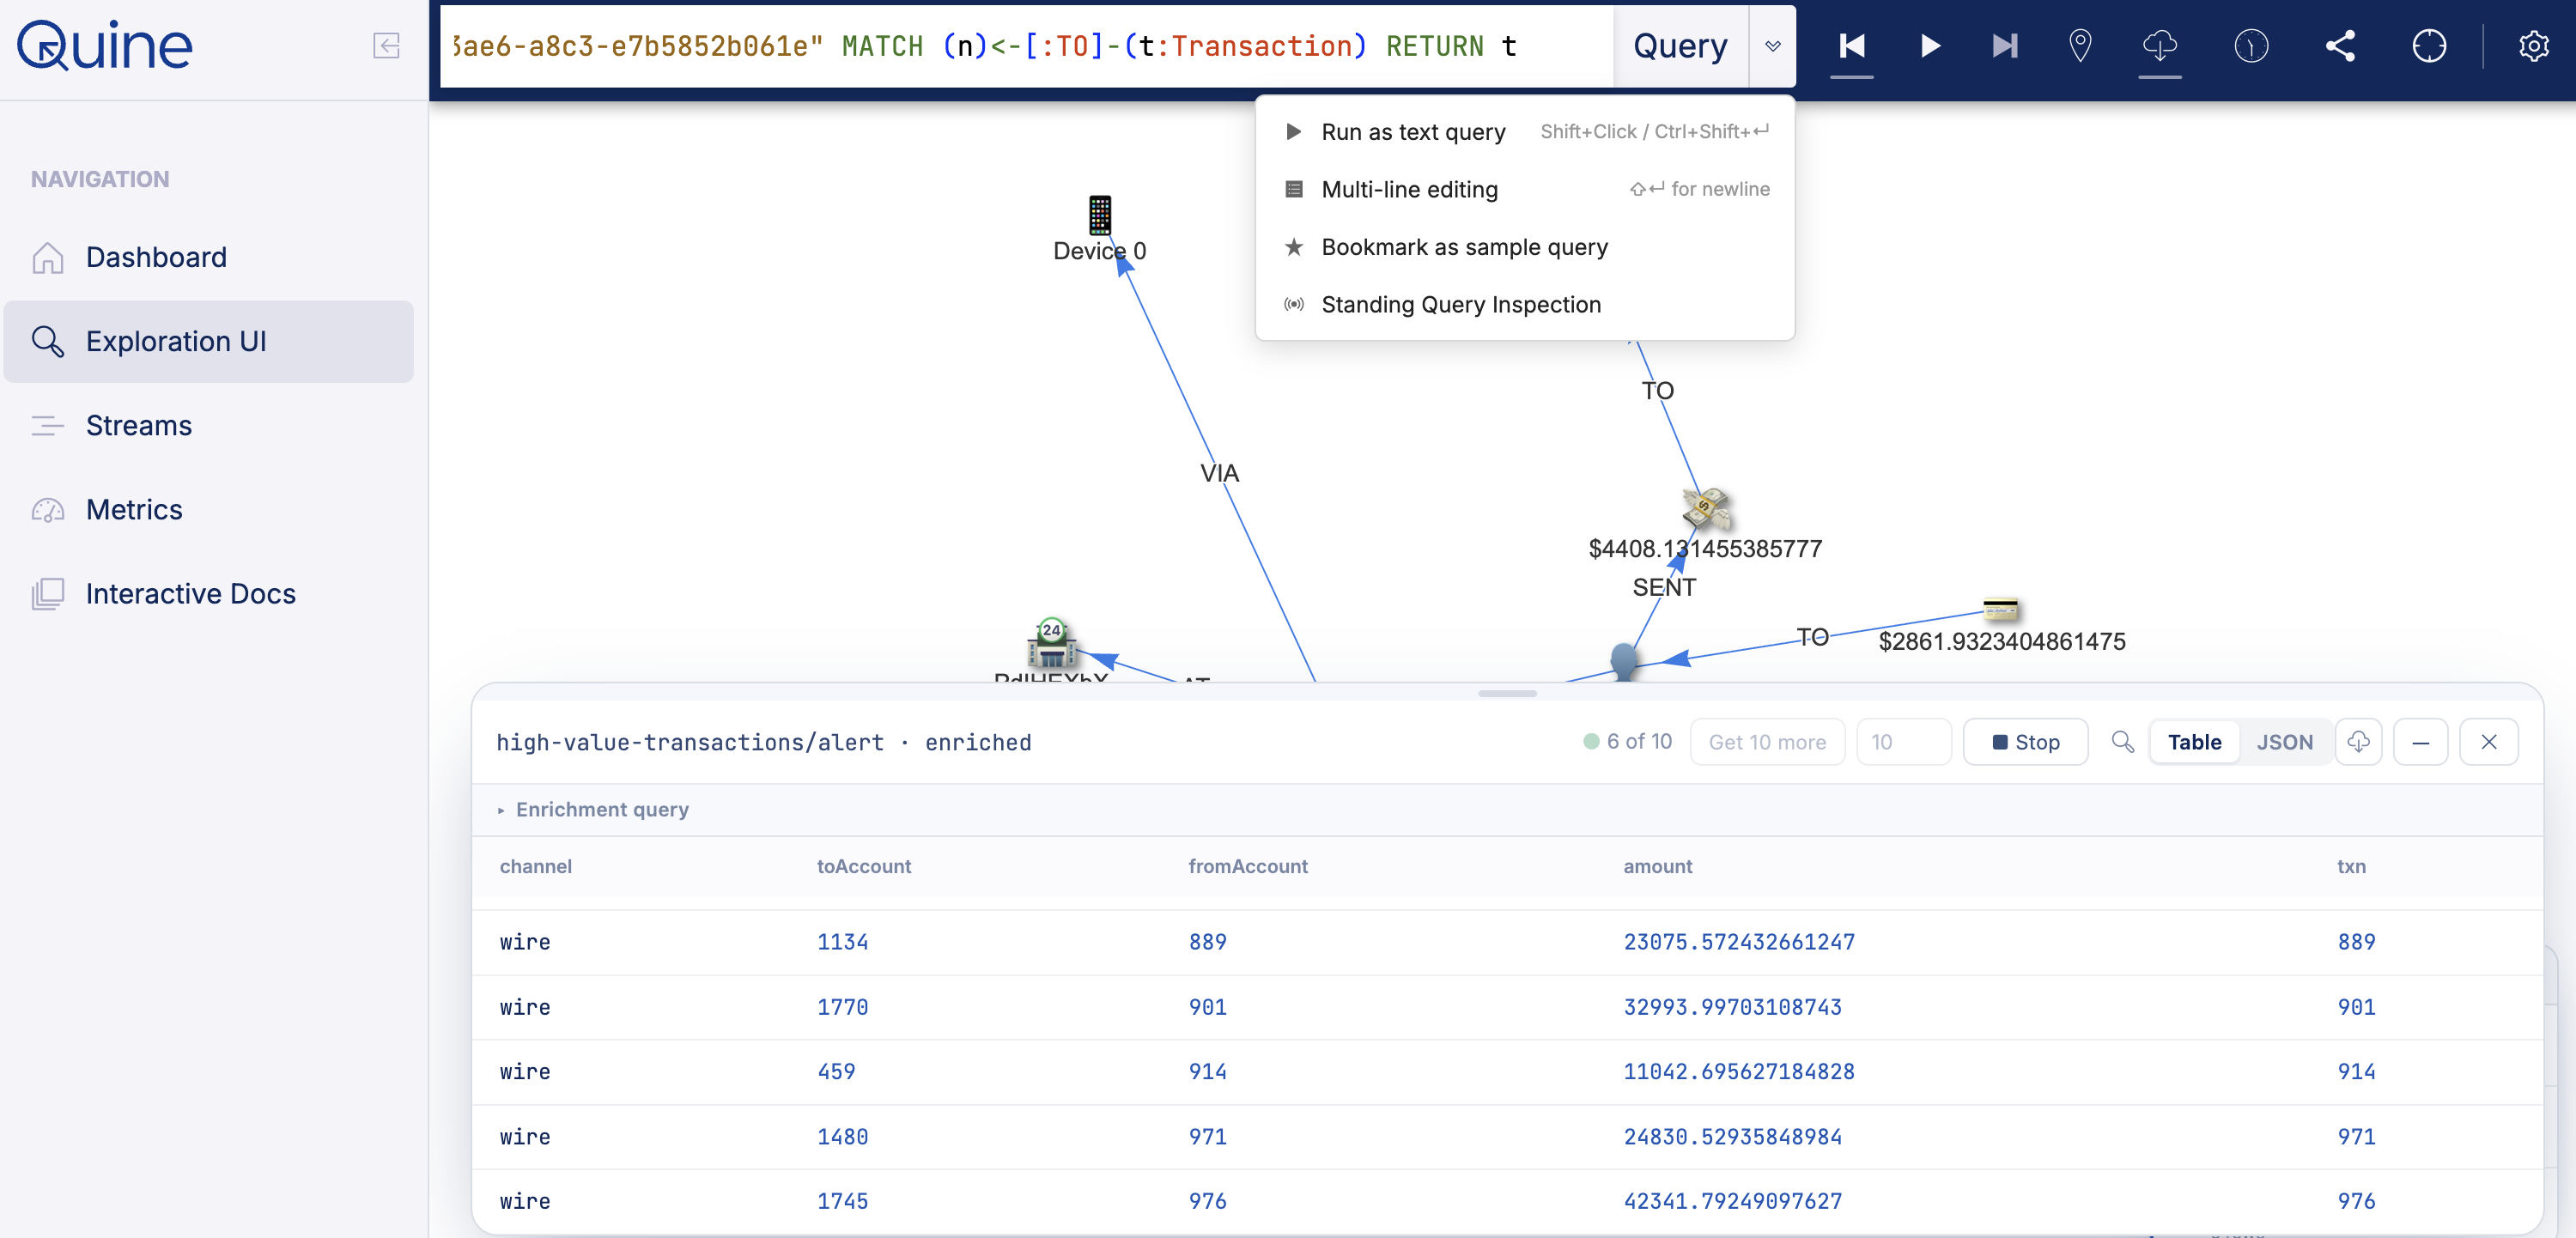
Tap into a standing query's output and watch its enriched results stream into a card, live, over the graph it is matching.
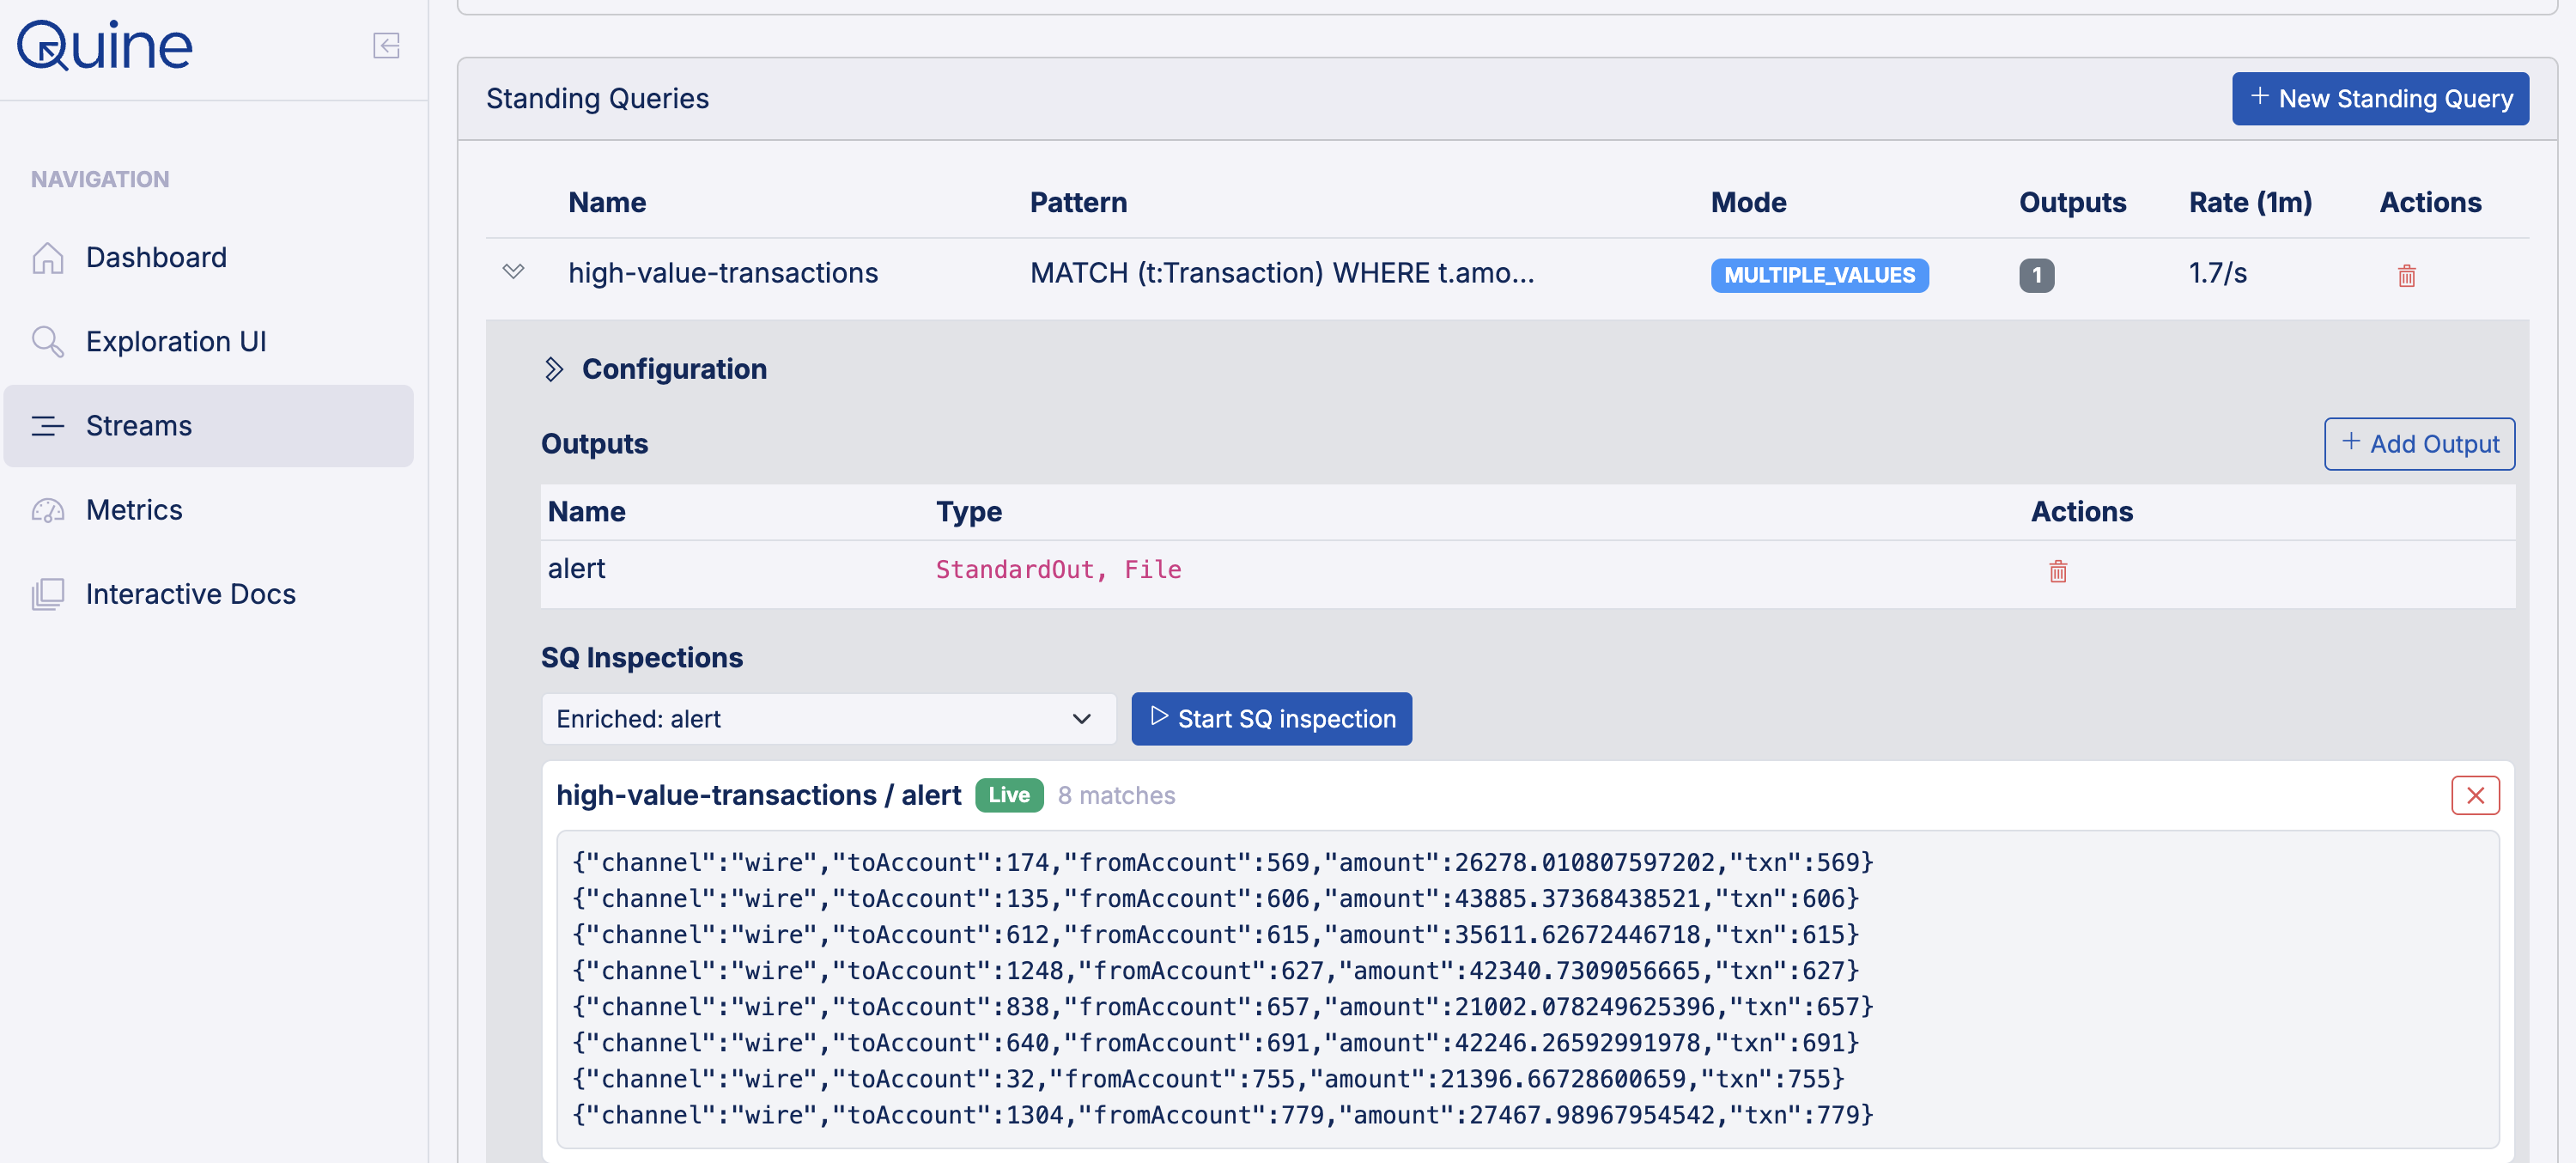
Inspections can also be run from the Streams page.
Flexible ingest and output workflows
Getting data in and out of Quine is built around workflows on both sides, each a series of steps you can shape to fit your needs. On the way in, an ingest can optionally run a JavaScript transformation step before its ingest query, so you can do complicated reshaping in JavaScript, where that kind of work is easy to write and reason about. Then clean, well-formed data can flow to the Cypher query that writes it into the graph, keeping those queries clear. Records that fail along the way can be routed to a dead-letter queue, which is itself a full output workflow, so a failed record is something you can handle deliberately.
On the way out, a standing query's output runs through a workflow of its own. A result can be reshaped by a JavaScript transformation, enriched by a callback query that pulls more data out of the graph, then formatted, encoded, and delivered to each of the downstream destinations you have configured. Ingests and outputs both support persistent configuration, as well as a broad suite of sources and destinations.
A modern consistent API
Under all of this sits API V2, which follows Google's API design guidelines so that its resources and verbs are named and structured consistently and predictably. That consistency makes the API easier to discover and learn, and it gives Quine a coherent foundation to keep building on, so the API can keep evolving in a way that stays familiar to the integrations written against it.
Using AI tools to build your pipeline? Point your agent at quine.io — it will find an llms.txt and robots.txt waiting to orient it, including a pointer to the machine-readable OpenAPI spec so it knows the exact format and options to use. Go one step further and it picks up all the hand-written advice from Quine experts, so you can build the perfect pipeline in mere minutes.
The Quine Recipe Analyzer
New alongside this release, though not built into Quine itself, the Quine Recipe Analyzer takes a recipe, or any set of ingest streams and standing queries, and visualizes it as a diagram of how the pieces connect, then points out where you can tighten it up. It is a fast way to sanity-check your data model before you run it. Drop yours in at thatdot.com/quine/recipe-analyzer.html.
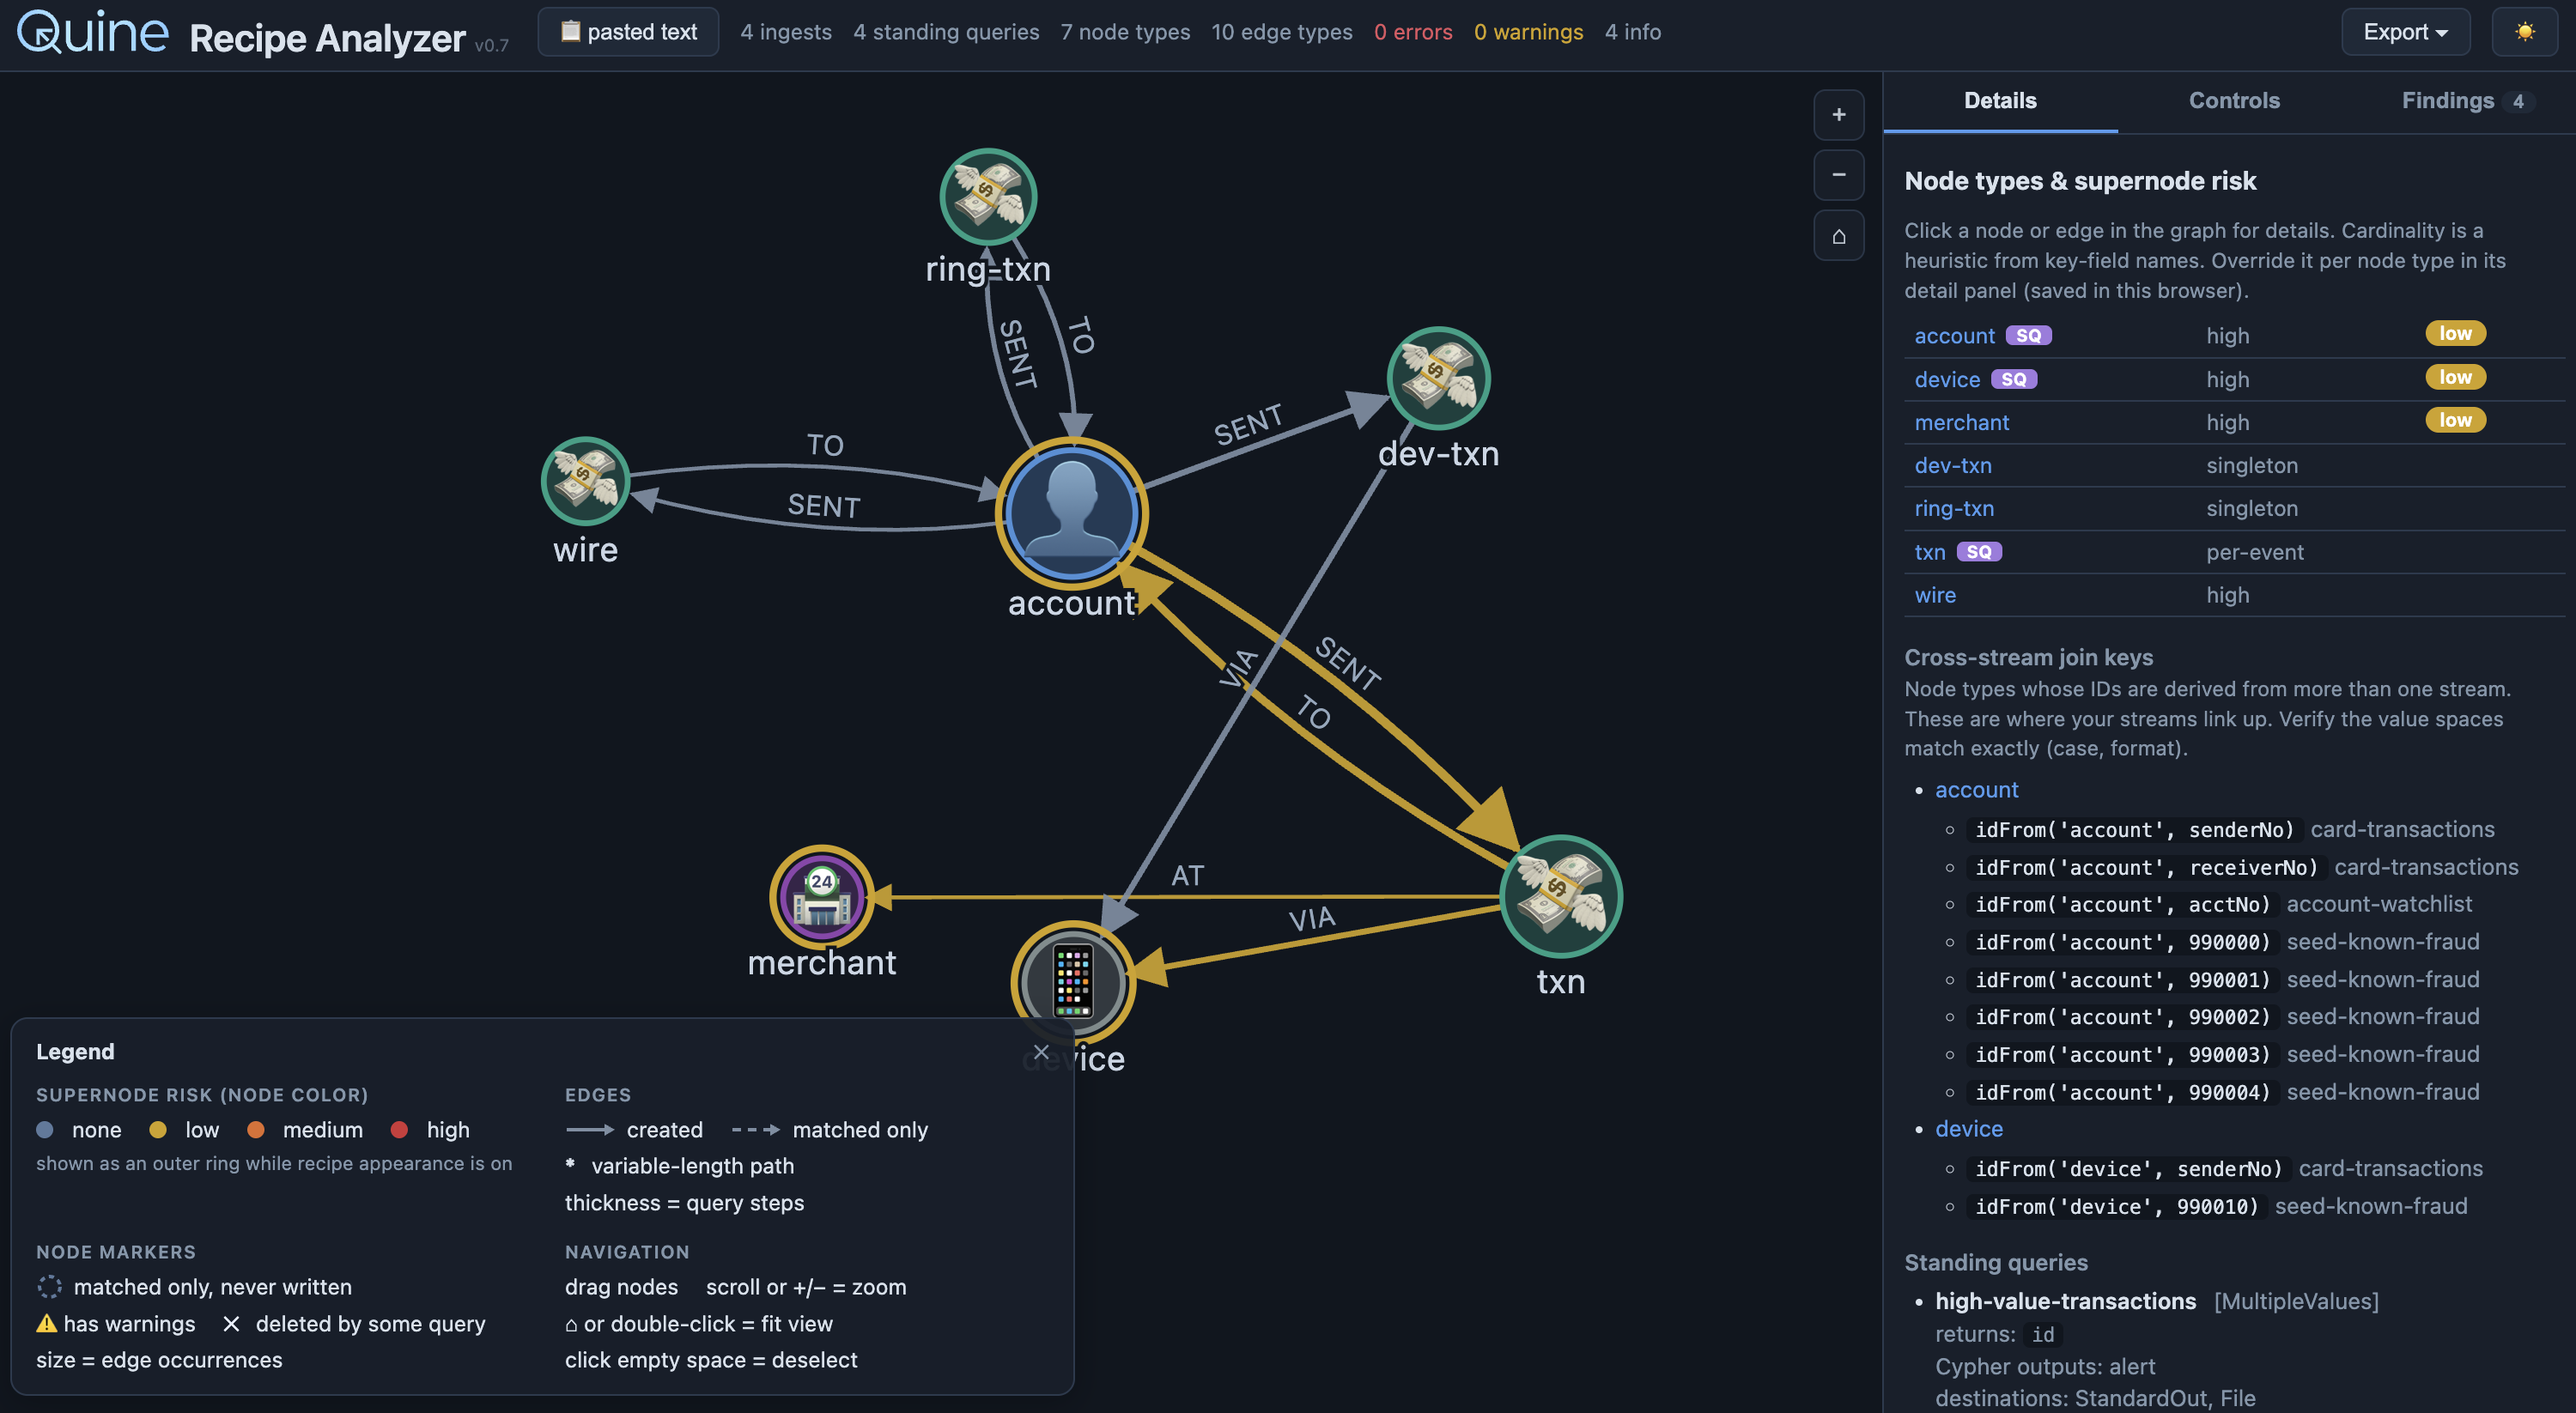
A recipe processed by the analyzer, drawn as its schema, colored by supernode risk, with a breakdown of how its streams join up, and how the standing queries map to the schema.
Get the latest
Quine 2.1.0 is available now. Download the jar from the latest release and try it on your own graph, or browse the release notes for the full details behind everything covered here, and more.
Got an Enterprise-sized problem? Quine Enterprise is built to scale with horizontal scaling, RBAC, audit logging, multi-tenancy, supernode mitigation, and many other features specifically meant to turn your Quine OSS proof-of-concept into a long-running reliable reasoning engine for your enterprise data streams. Learn more and compare the OSS vs. Enterprise capabilities here.