A Live Event Stream, a CDN, and a Manifest Services Provider Walk into a Bar
Video observability, or the end-to-end monitoring of complex video streaming architectures, entails some of the most challenging aspects of data engineering. A live event will usually traverse three and sometimes more partner systems on its path from origin to the end user.
Until recently, no single service provider in this chain of delivery had access to performance metrics of upstream or downstream providers, making diagnosing and resolving issues more difficult. But as standards begin to emerge for data sharing between partners, a new challenge has emerged: how to combine enormous amounts of high cardinality and high dimensionality data, formatted inconsistently, into a single cohesive view that can be acted on in real time?
Quine is a streaming graph processor that provides a unique solution for solving all of these challenges by combining graph data modeling (e.g., Neo4J) with highly efficient event stream processing (e.g., Flink or ksqlDB).

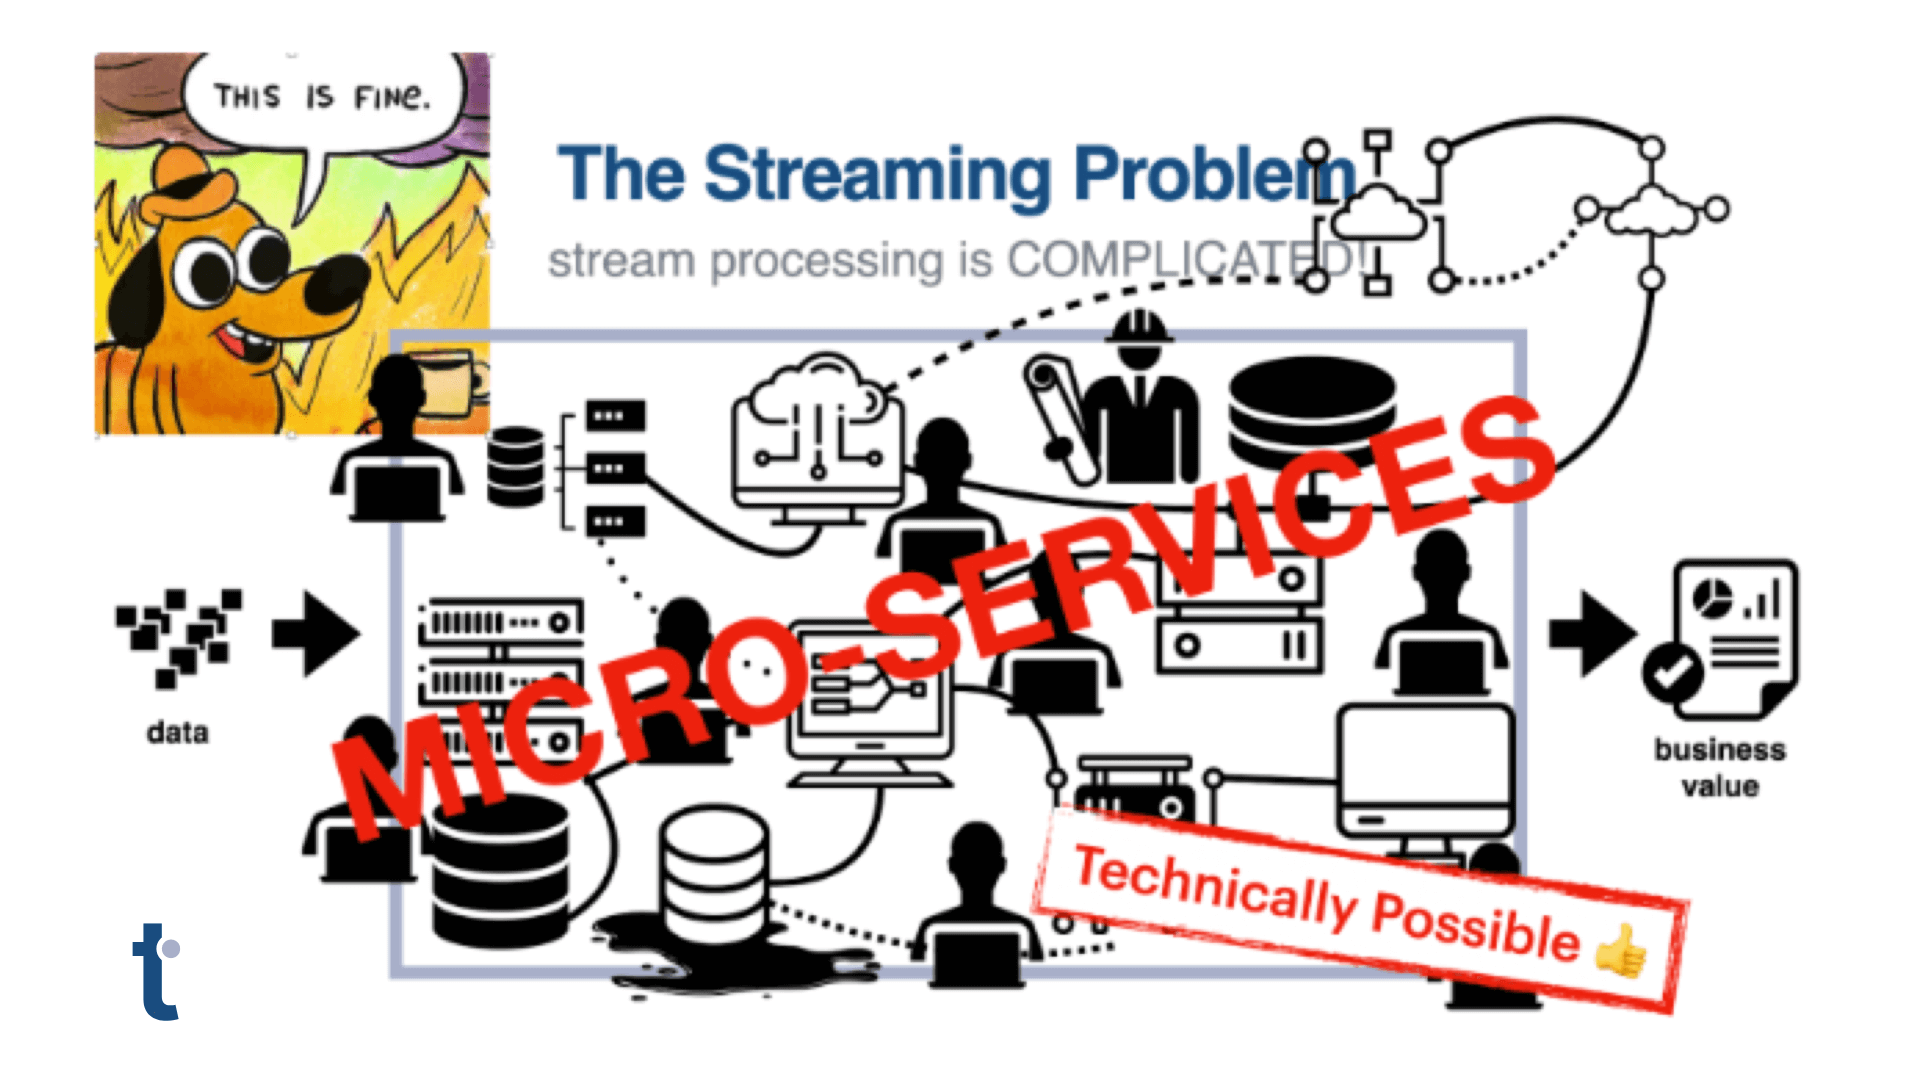
End-to-end video observability is complicated by the many platforms and services a single stream traverses.
Video Observability Is Hard
End-to-end video observability is challenging for many reasons:
- Multiple services from multiple vendors: No one vendor operates the entire platform. Critical-path services include: origins, trans/encoders, manifest services, entitlement services, ad services, CDNs, and video players. Each element generates its own logs with different formats for user, client, and session IDs, time stamps, and focuses on different parts of the platform.
- Many Dimensions to Track: Even when these logs are combined and somehow synchronized, you encounter high data dimensionality: device hardware configurations, device software versions, client IPs, server IPs, video player versions, video assets versions, etc.
- High Data Cardinality: Subnets and IPs, country/state/city designations, time stamps, and the combination of these with all the above dimensions.
- Categorical Data: Most log data are non-numbers – URL strings, classifications, asset titles, IP addresses, etc. and while valuable, this data is often discarded. Encoding these values to numbers is very difficult to manage and not always useful.
- Scale: Live video events generate significant volumes of data within very short time periods, as live broadcast events start for millions of viewers.
- Real-time events need real-time fixes: the time to fix a video streaming issue is when the issue is ruining the user experience, especially for live streams.
Multiplying Complexity
Any one of the above reasons presents a significant barrier to correctly detecting and diagnosing network issues. Take this entire matrix of possible data combinations and operational challenges together and you are faced with a significant challenge to model and analyze the end-to-end behavior of live events in time frames suitable for remediation. Additionally, the costs of legacy log analysis tools are prohibitive at scale. As a result, most broadcasters monitor individual elements of the video delivery workflow and use intuition to link element behavior on the end-to-end system. Sometimes, this doesn’t work out so well.
What Data Structure For Video Observability?
As described in an earlier blog, Defining Video Observability, combining event data from each component of the video delivery workflow is required to understand the contributions of each component of the end-to-end video delivery experience.
Connecting the logs of Origins, Manifests services, and CDNs provides several meaningful benefits to:
- understand the impact of one system component on the complete system and other components.
- build and measure KPIs that align with user experience.
- prioritize issues based on their impact to user experience.
- identify root causes of identified problems and issues.
Assembling log and event data into a holistic end-to-end view allows operators at any point in the experience stack to quickly identify an issue’s root cause and enables real-time remediation and automation. Without a representation of the entire system, it is quite common to incorrectly diagnose causes, wasting time and good will with operations staff, vendors, and customers.

The emerging CMCD standard represents a more efficient mechanism for matching CDN and video player client data to correlate video stream viewer experience with the CDNs that delivers the video streams. I’ll dig deeper into the specifics of CMCD in a future post.
Solving Multi-Source Data Ingestion Challenges
Synthesizing a unified view from multiple event streams in real time presents operational challenges as well as some of the data-specific problems discussed above. When millions of devices are connecting to global CDNs with thousands of POPS in dozens of countries, data will almost certainly arrive out of order. As partners, event types, and platforms change, schemas must be able to react without downtime. And, perhaps most importantly of all, detecting patterns that indicate issues and acting on them instantaneously can be a challenge for most databases. Quine, which combines a graph data model with the real-time capabilities of event stream processing, is built to solve these operational issues.
Streaming Graph Efficient Analysis
Log event dimensionality and cardinality are a critical challenge in video observability. Near endless combinations of data, as shown below, require hundreds of tables in traditional RDBMS systems. Joins of tables to connect data from multiple tables are compute intensive and the costs of these joins increases with the number of tables. The cost to query across tables is particularly expensive when there is a “fan out” of one table to subsidiary tables as shown with “Asset” in the image.
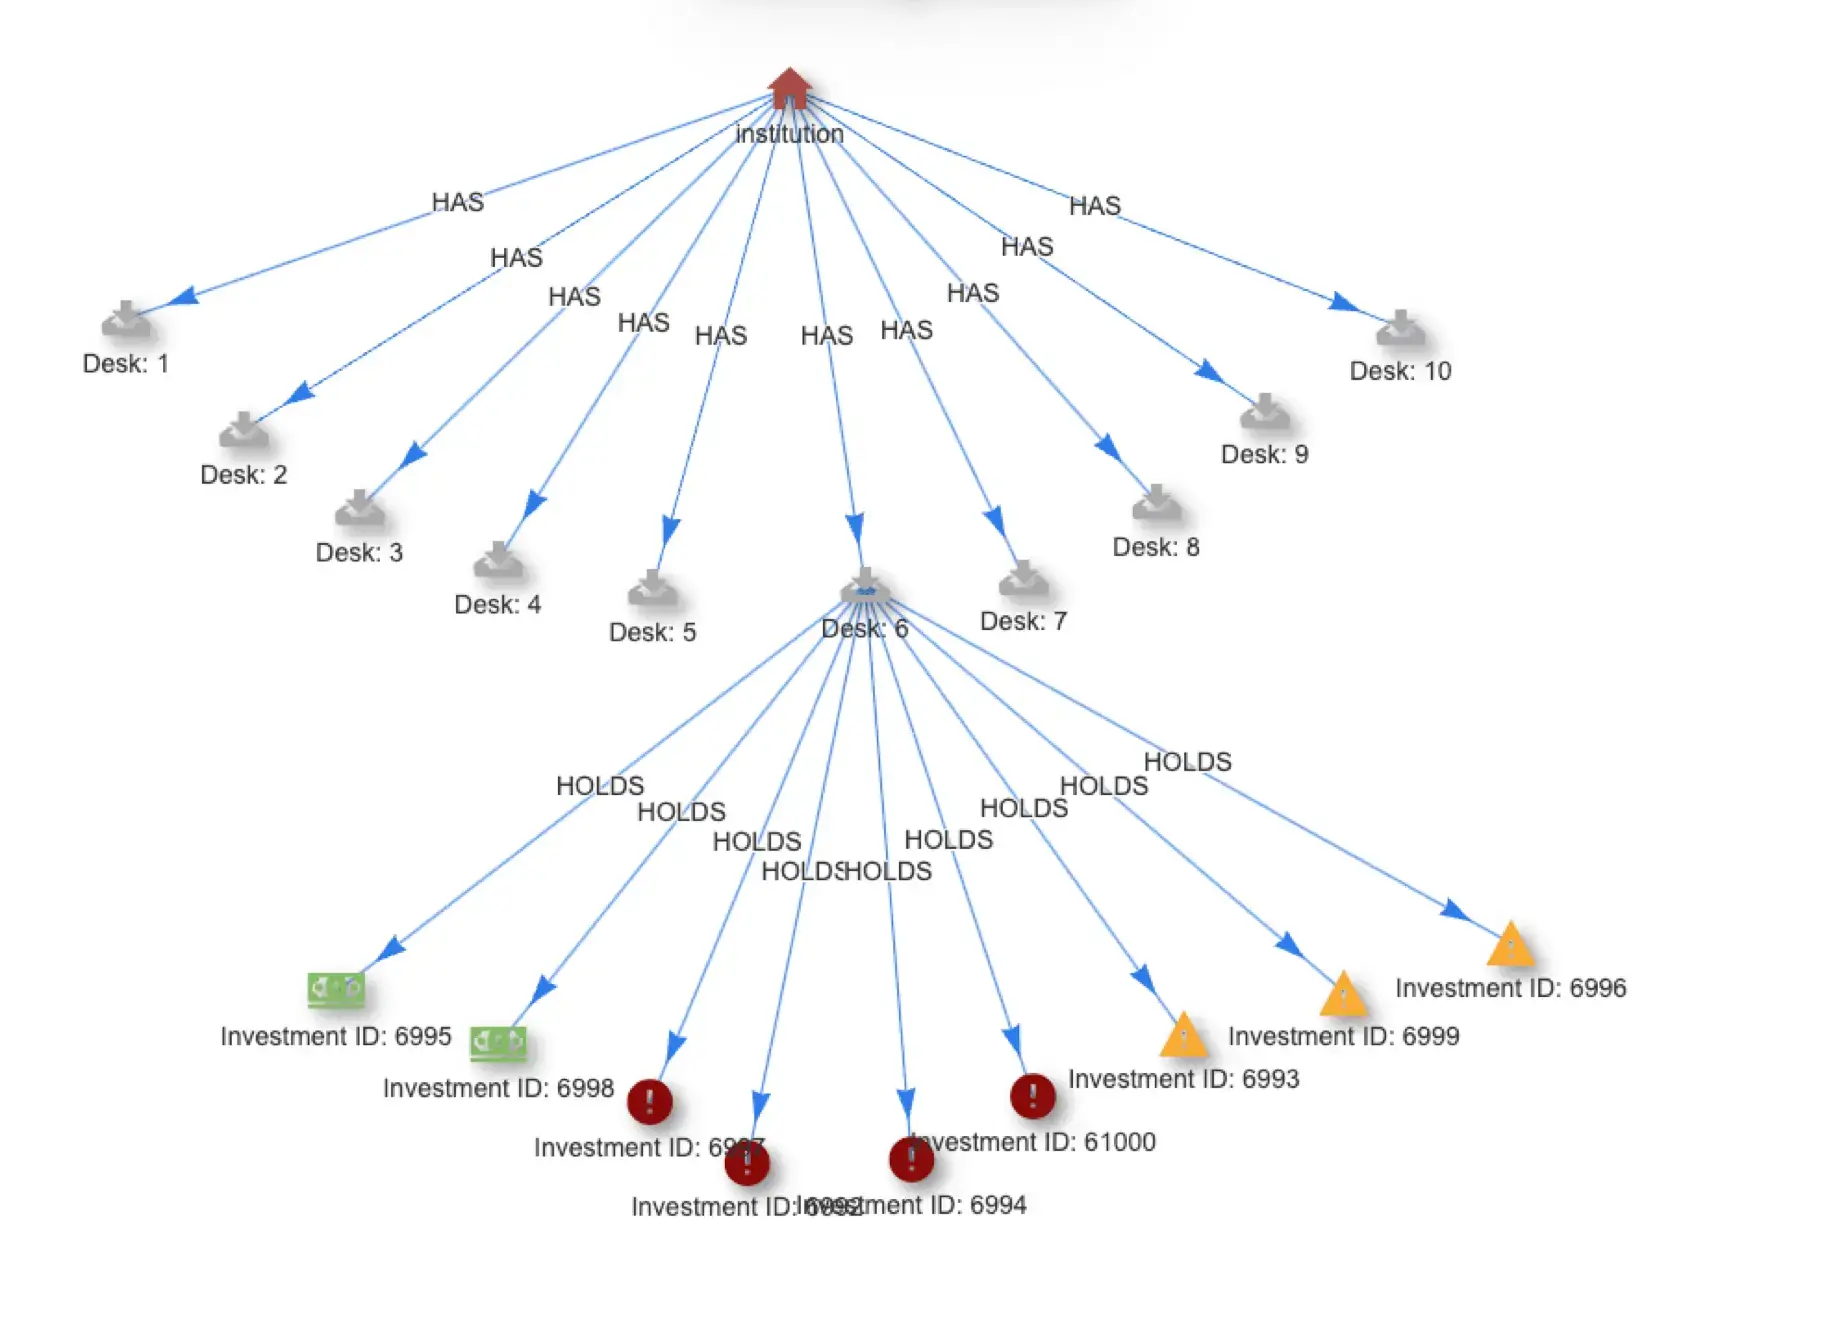
Graph data modeling offers an alternate approach, storing dimensions that would be rows in tables as nodes and describing the relationship between nodes as edges. This model makes associating a video playout event with the CDN, user, asset, geography etc., a very low cost action. When applied to video observability data at scale, the efficiency of graph is significant as compared to traditional RDBMS operations.

Graph data structures provide an excellent alternative to relational models for real-time analysis.
Importantly, once data is stored in the streaming graph, we can define new KPIs that encompass insights from each element of video delivery workflow. Calculating a continuous state for end-to-end latency, or tracing the current state of CDN or asset health for a specific geo/ASN/CDN becomes trivial, even though this represents hundreds of thousands, or even millions, of separate values.
Categorical Data
Categorical data — content titles, email addresses, process IDs, IP addresses — is incredibly valuable for root cause analysis and, amazingly enough, frequently ignored by enterprses. Quine greatly expands the utility of log data and the effectiveness of log analytics by processing non-numerical data in its natural, categorical form. The avoidance of one-hot encoding simplifies data management and reduces computation needs, while making the system more human-friendly to operate.
Knowing When to Act on Streaming Data
A significant advantage of the Quine streaming graph is its ability to generate actions in real time as data arrives. It does this using a feature unique to Quine: standing queries.
Think of standing queries as a sort of filter placed inline with the event stream, watching for any event data that is part of a pattern of interest – for example, a series of events that suggest an issue with a POP’s network or client connectivity. As new events are ingested into the graph, standing queries update this partial match waiting and watching for a full match to occur.
Traditional systems must continuously query to see if a full match has occurred. This is an expensive operation and introduces delays. With Quine, when a full match occurs, action is instantaneous. Possible actions can include anything from sending alerts to other systems (via Kafka, Kinesis, HTTP POST, and more) to updating the graph data itself.
Either way, by acting in real time, Quine can be the difference between anticipating and avoiding an issue and trying to fix it once it has already occurred.
Out-of-Order Data Handling
In a distributed system of global scale, events do not always arrive in the order they were created. Systems that have dropped off the network can send event data when they reconnect seconds, minutes, hours, or even days later.
Quine solves this by maintaining partial matches to queries, adding to the graph as data arrives and triggering actions like alert messages when a complete match is made. The order, and the interval between events in a pattern, do not matter.
For example, the creation of a “user video session” will complete as soon as the periodic client beacons, CDN logs for video chunks, origin server logs, and manifest files all arrive.

An Example of Real-time Root Cause Analysis
The combination of all these streaming graph capabilities produces a system well suited for ingestion of logs of events characterized by highly dimensional, categorical data from multiple systems or sources, as well as the evaluation of this data for outage or service degradation conditions in real time.
Consider an example using client, CDN, and origin logs where the goal is to identify and track patterns of events suggestive of performance issues that could lead to service degradations and issue specific, actionable alerts when the number of these events (which I call KPIs here) exceed a user-defined threshold.
After ingesting events into Quine, standing queries will continuously evaluate arriving data for patterns of service failure or degradation. When these “issue causes” are identified for any new data, high level KPIs (e.g. count of failure events for a server or Geo/ASN) will roll up the individual events to assess the significance of issues.
When KPIs indicate a significant issue is occurring, the root cause definition is already known and made available to upstream systems for automated remediation, or published to NOC ticket management systems.

The figure above illustrates the events Quine monitors for and, in this case, a real-time alert (in red) that reports client-observed re-buffering at significant enough volume to warrant investigation, and with identification that the issue is related to a CDN edge server in Tampa that is service users on the AT&T ISP (in orange).
The alert that is issued provides the information an operator would need to understand and take action on an issue. Standing queries can publish this alert, and/or the raw event data that contributed to the KPI threshold being met, to Kafka, Kinesis, an API or even Slack — whatever fits the desired workflow.
Without a graph data structure, combining all this categorical and numerical data into a single materialized view and quickly traversing connections to detect completed patterns would not be possible. However, unlike graph databases, Quine is designed to process process high volumes of event data and trigger alerts in real time.
All this adds up to more reliable stream delivery, more revenue, satisfied advertisers, and most importantly of all, happy customers.
Try Quine Streaming Graph Yourself
If you want to try it on your own logs, here are some resources to help:
- Download Quine – JAR file | Docker Image | Github
- Check out the Ingest Data into Quine blog series covering everything from ingest from Kafka to ingesting .CSV data
- CDN Cache Efficiency Recipe – this recipe provides more ingest pattern examples


