Streaming Graph Means Real-time Root Cause Analysis
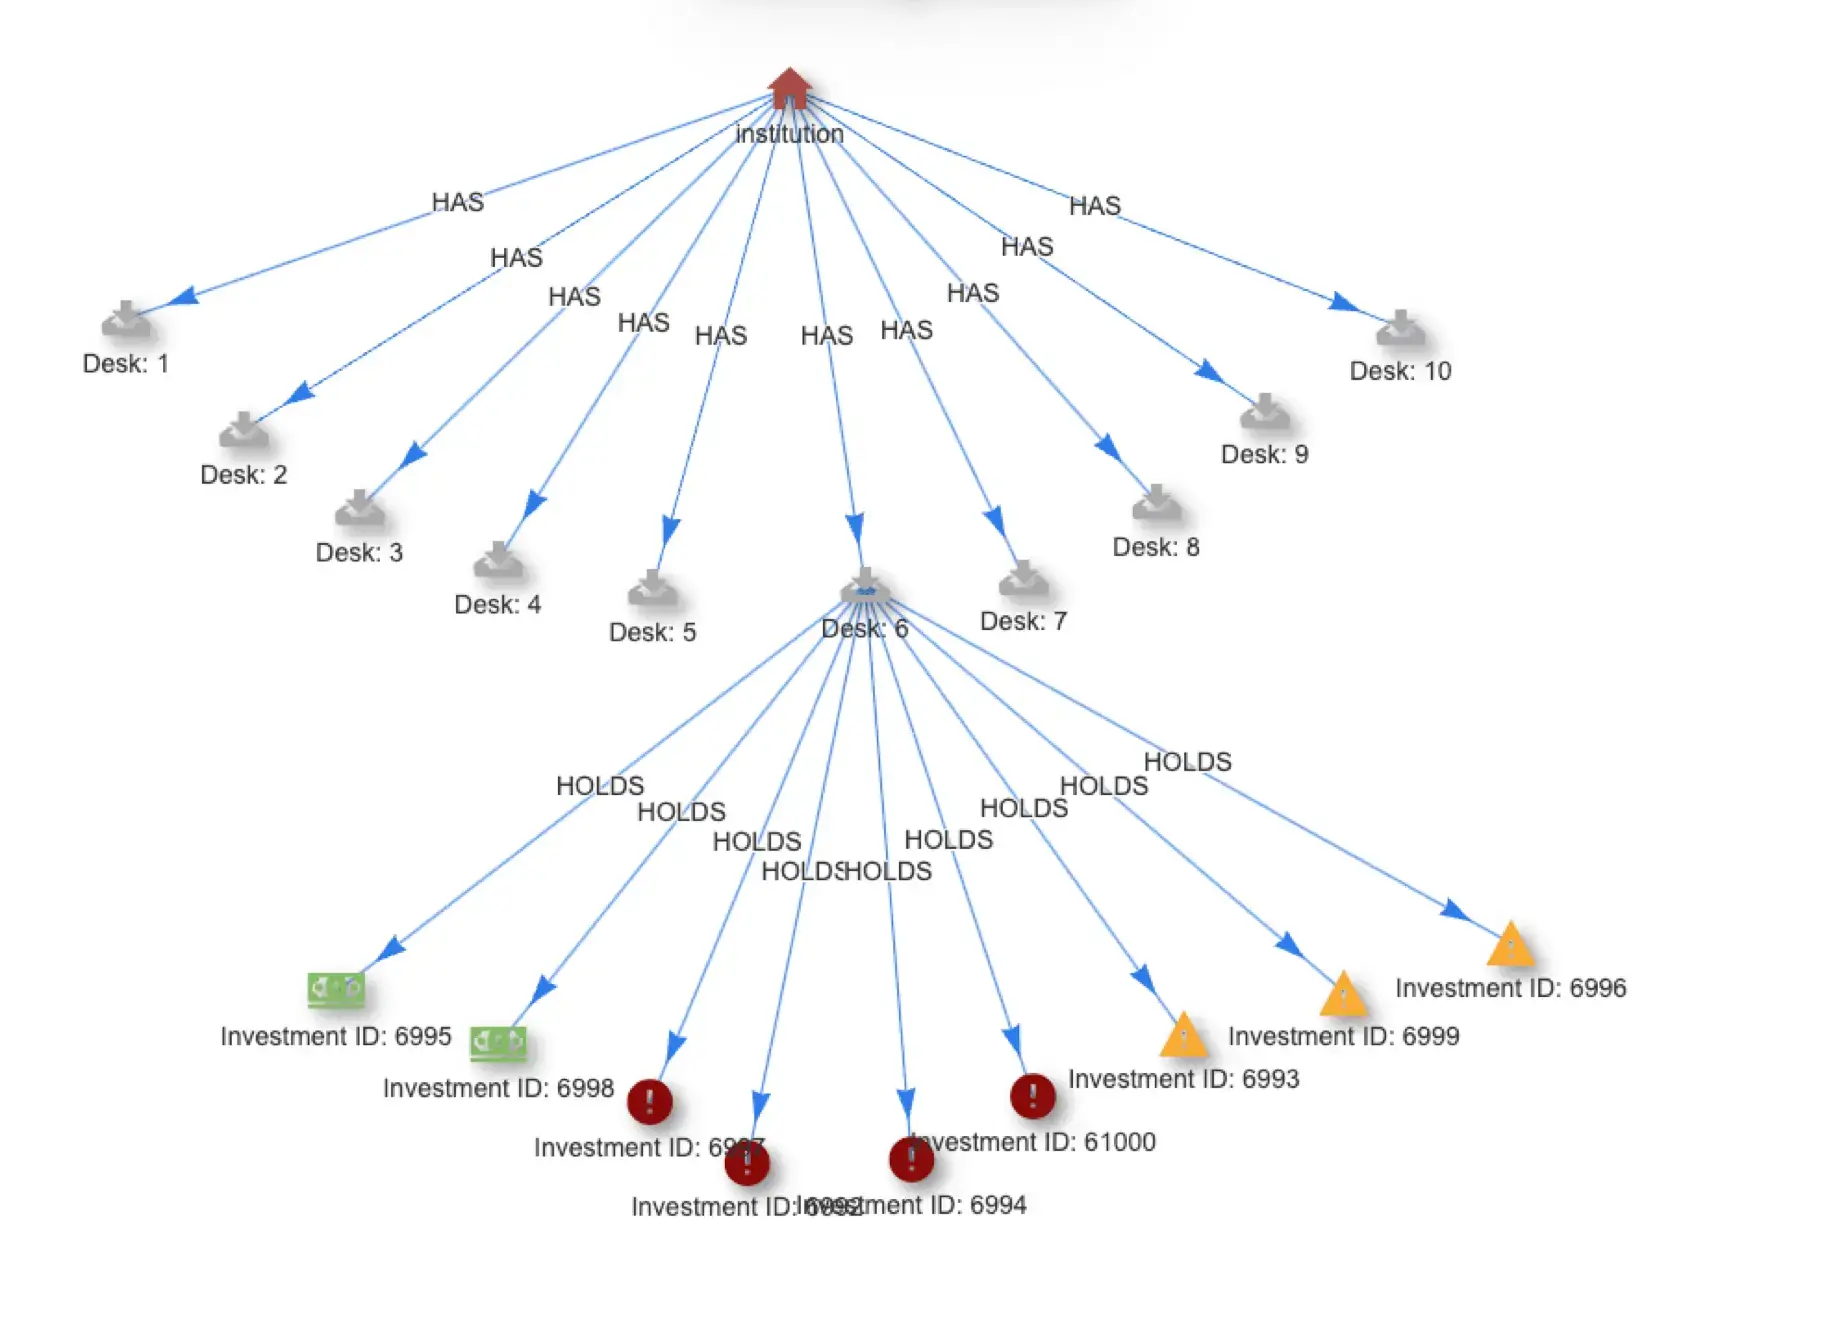
Imagine if the next time your video streaming operations dashboard-of-choice warns you that 100 users experienced video start failures in the last minute, it was only one click to see each of those sessions and that they are all related to a corrupted file for a single bit rate of an iOS-specific encoding of an asset on one of your CDNs. Better yet, your platform triggers a workflow to have this specific bit rate version of the asset re-encoded and uploaded to the CDN.
Video observability can make this a reality.
We enjoyed Mux’s recent blog, “What Is Video Observability”, and thought to expand on Steve Lyons’s discussion. General observability solutions such as Splunk and DataDog ingest and aggregate CDN and origin logs as well as metrics from video specialists like Mux Data to provide dashboards that help support video services. Operations teams overlay charts in these dashboards in their search for context, and then, based on intuition, dive into individual systems to explore granular event data to debug issues and answer cause-and-effect questions.

Traditional Monitoring-Based Video Observability
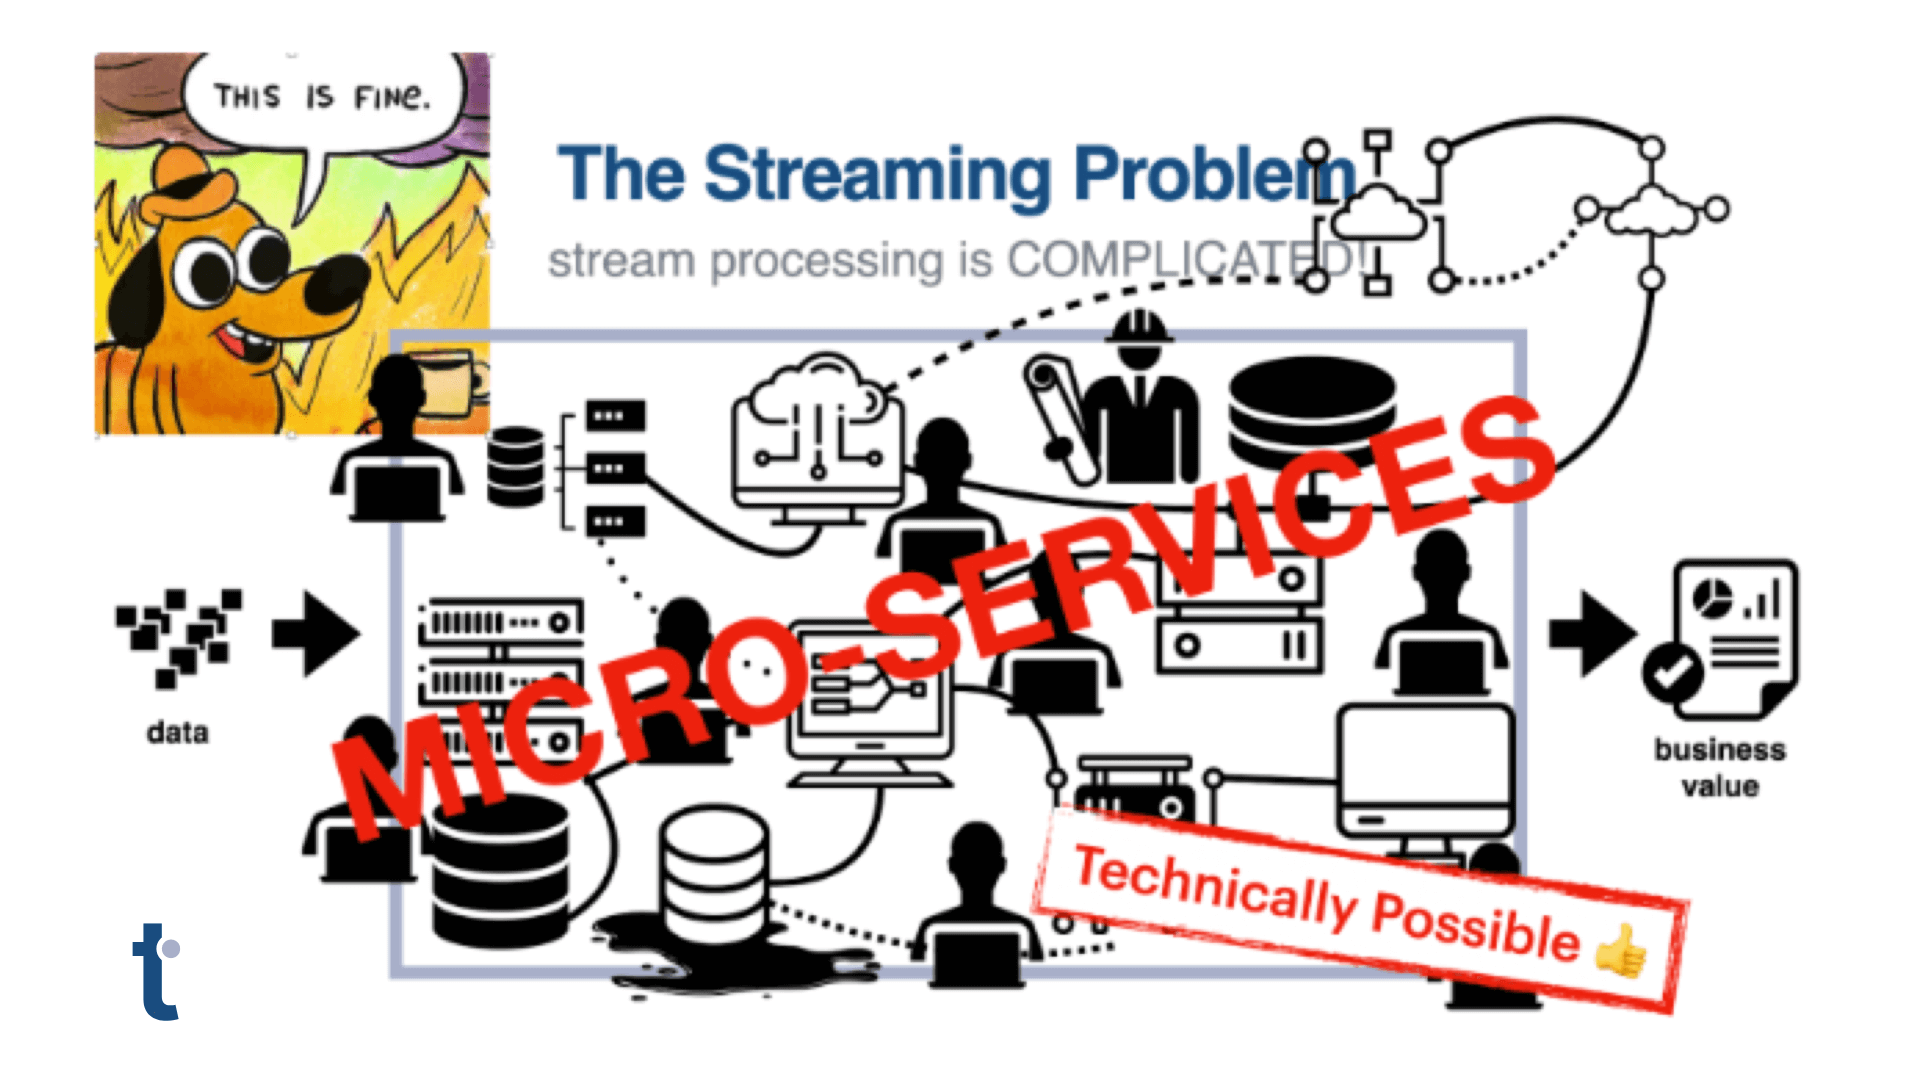
This aggregated monitoring scales well, but shortchanges our ability to understand cause and effect, complicates debugging and forces our understanding of the system into functional components instead of a human natural or logical view. What if, instead, we preserved all the granular data while also building abstracted views of our end-to-end platform to enable a new paradigm in actioning from our data? To accommodate this new model, we need to keep the raw event data but also transform it into sessions and then new composite metrics that span multiple elements of our platform for more holistic analysis and alerting. To achieve this definition of video observability we need to rethink our data pipeline as follows.

Video Observability Solution Elements
Video streams are what our audiences are experiencing and paying for, we should assess our platform’s performance in terms that relate to their experience. Once sessionized, our observability provides an inter-related view of the streaming platform as a single system, allowing us to see the cause and effect between packagers, CDNs, asset ID, players, etc. This holistic view allows us ask questions about the platform in more natural terms independent of the components.
– “What is the root cause of this rebuffering event?”
– “Is one CDN providing a better user experience than another?”
– “What part of the streaming platform is causing latency in our video streams?”
– “Are we delivering good quality video to users of the new Android OS?”

Granular and Sessionized Video Observability
Video observability enables us to see both the abstract system experience, as seen by our audience, while preserving the granular details we need for rapid discovery root causes to issues in our platform. When we have this high-confidence view of system element inter-relations we can streamline work processes and implement automation. Video observability brings opportunities to deliver both better customer service by reducing MTTR while also helping to free up our operations and engineering staff from time spent in “war rooms” inferring root causes.
Adopting this broader video observability definition supports our entire business. Developers can leverage this same insight to understand the impact of changes to individual components on the entirety of the system. Architects can use granular data to perform historical analysis without having to rebuild models from logs. Product managers can directly see the QoE benefit of new investments or lower costs infrastructure substitutions. In all cases, understanding the relationships between the logs, events and metrics in terms that relate to our services delivered enable such insights so we can take well-informed action.