As we enter a period of uncertainty, it is important to get more value from existing investments, including event stream processing infrastructure. Categorical data represents a largely ignored and untapped resource capable of providing significant business impact.
But categorical data has largely been ignored by enterprises. This post explores what categorical data is, why it has been ignored, and most importantly, the value it can unlock with minimal investment.
Categorical data contains important insights
There are two principal types of data: categorical and numerical. Numerical data, as the name implies, refers to numbers or metrics (e.g. temperatures, counts, scores or ratings.)
Categorical data is everything else – colors, product models, addresses (IP and terrestrial), telephone numbers. And what is more, categorical can express the relationship between objects – an individual and their favorite color or the education distribution by postal code are two examples.
Categorical data is vast and expressive, describing attributes of the real world which, for enterprises, can provide the holy grail of insights: understanding and even predicting behavior.
Example
Eliminating False Positive Security Alerts Counting the frequency of an employee accessing a high-value service is easily described with numerical values: UserID, Service#, CountofAccessAttempts. Categorical data, on the other hand, provides a rich context that can be used to identify attackers with much higher confidence, and the categorical data is already in our logs: UserID, UserAgent, DeviceOS, ServerIP, FilePath, TimeofDay. This more complete context can eliminate false positives creating significant ROI and happier analysts!
So why is categorical data ignored?
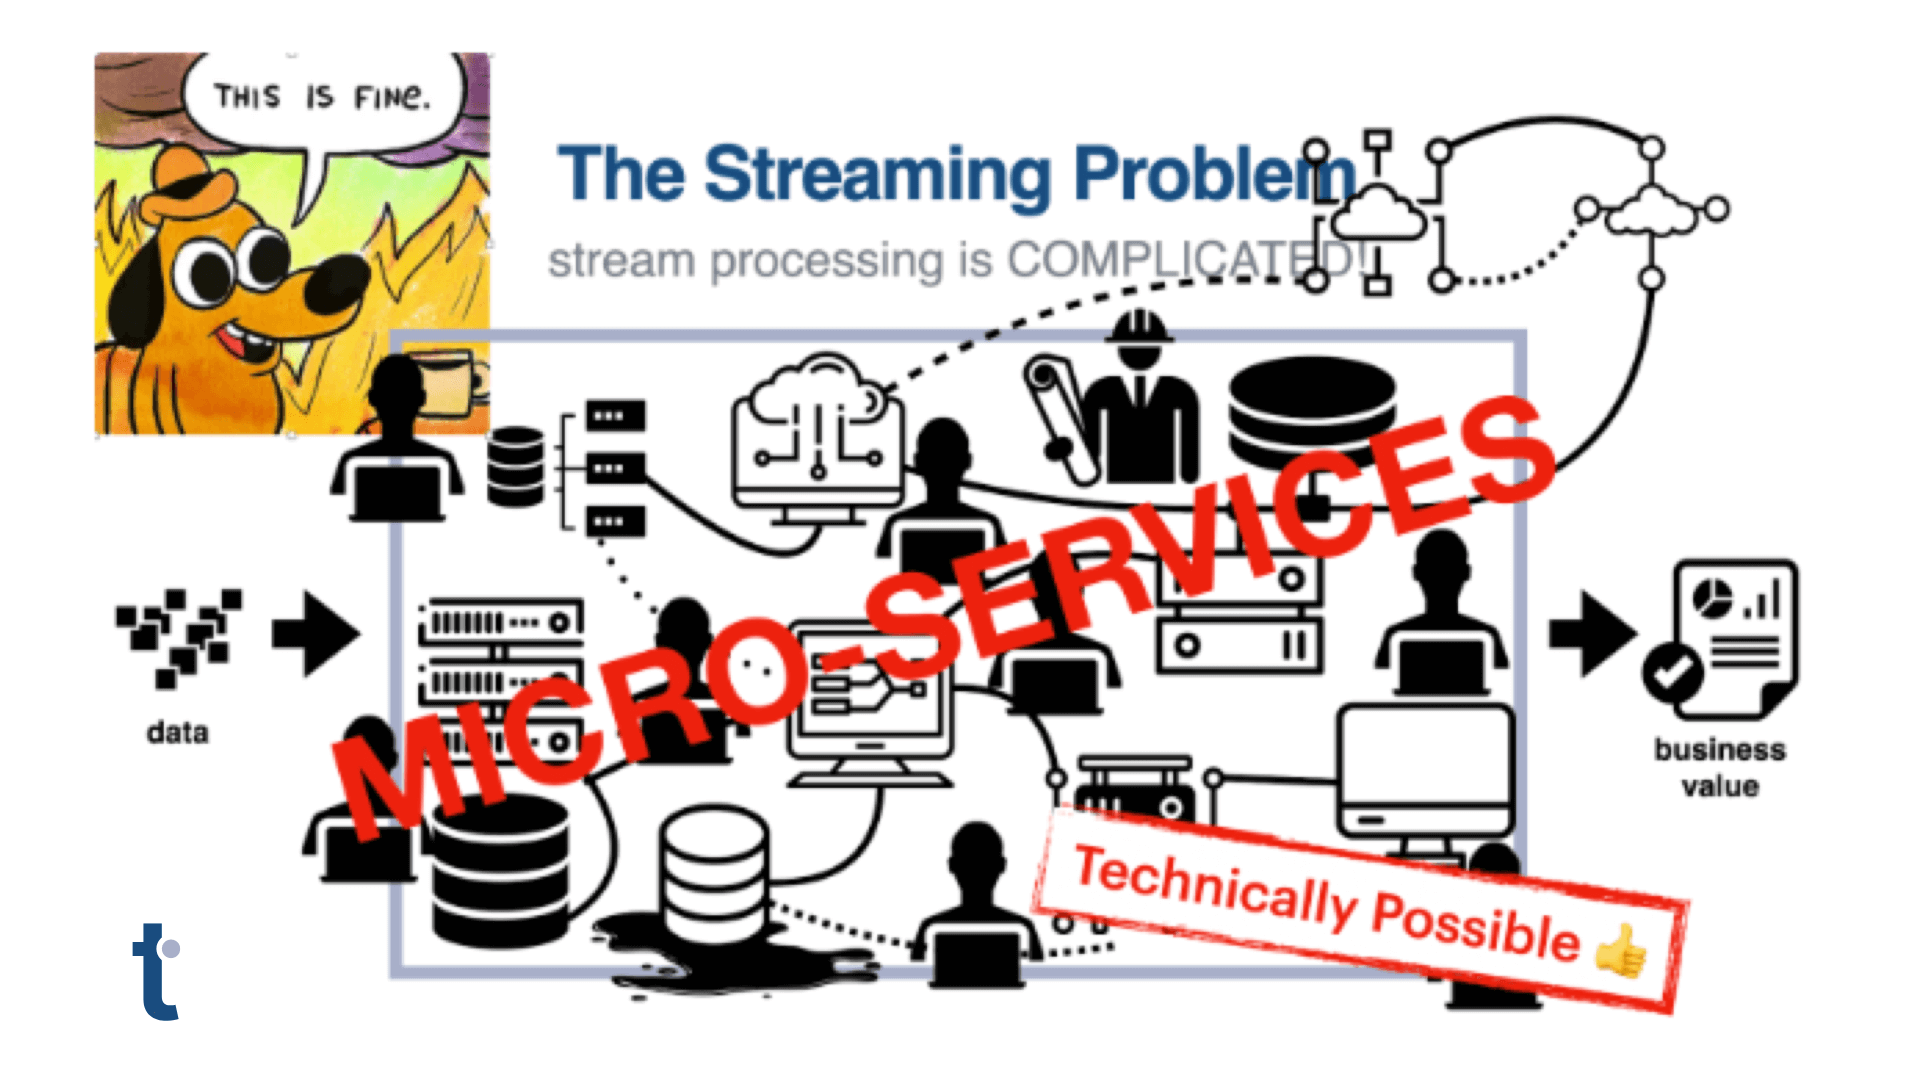
The simple answer is that today’s tools are not really designed to work with categorical data, particularly for real-time event processing. That has started to change in recent years with the emergence of knowledge graphs like Neo4J and Janus graph, however current graph databases can’t scale to handle real-time data volumes.
Instead, enterprises must resort to encoding categorical data into numerical values so it can be processed with current event stream processing systems, a computationally expensive operation that obfuscates the very same relationships between objects that makes categorical data so valuable.
Quine streaming graph for real-time behavioral insights
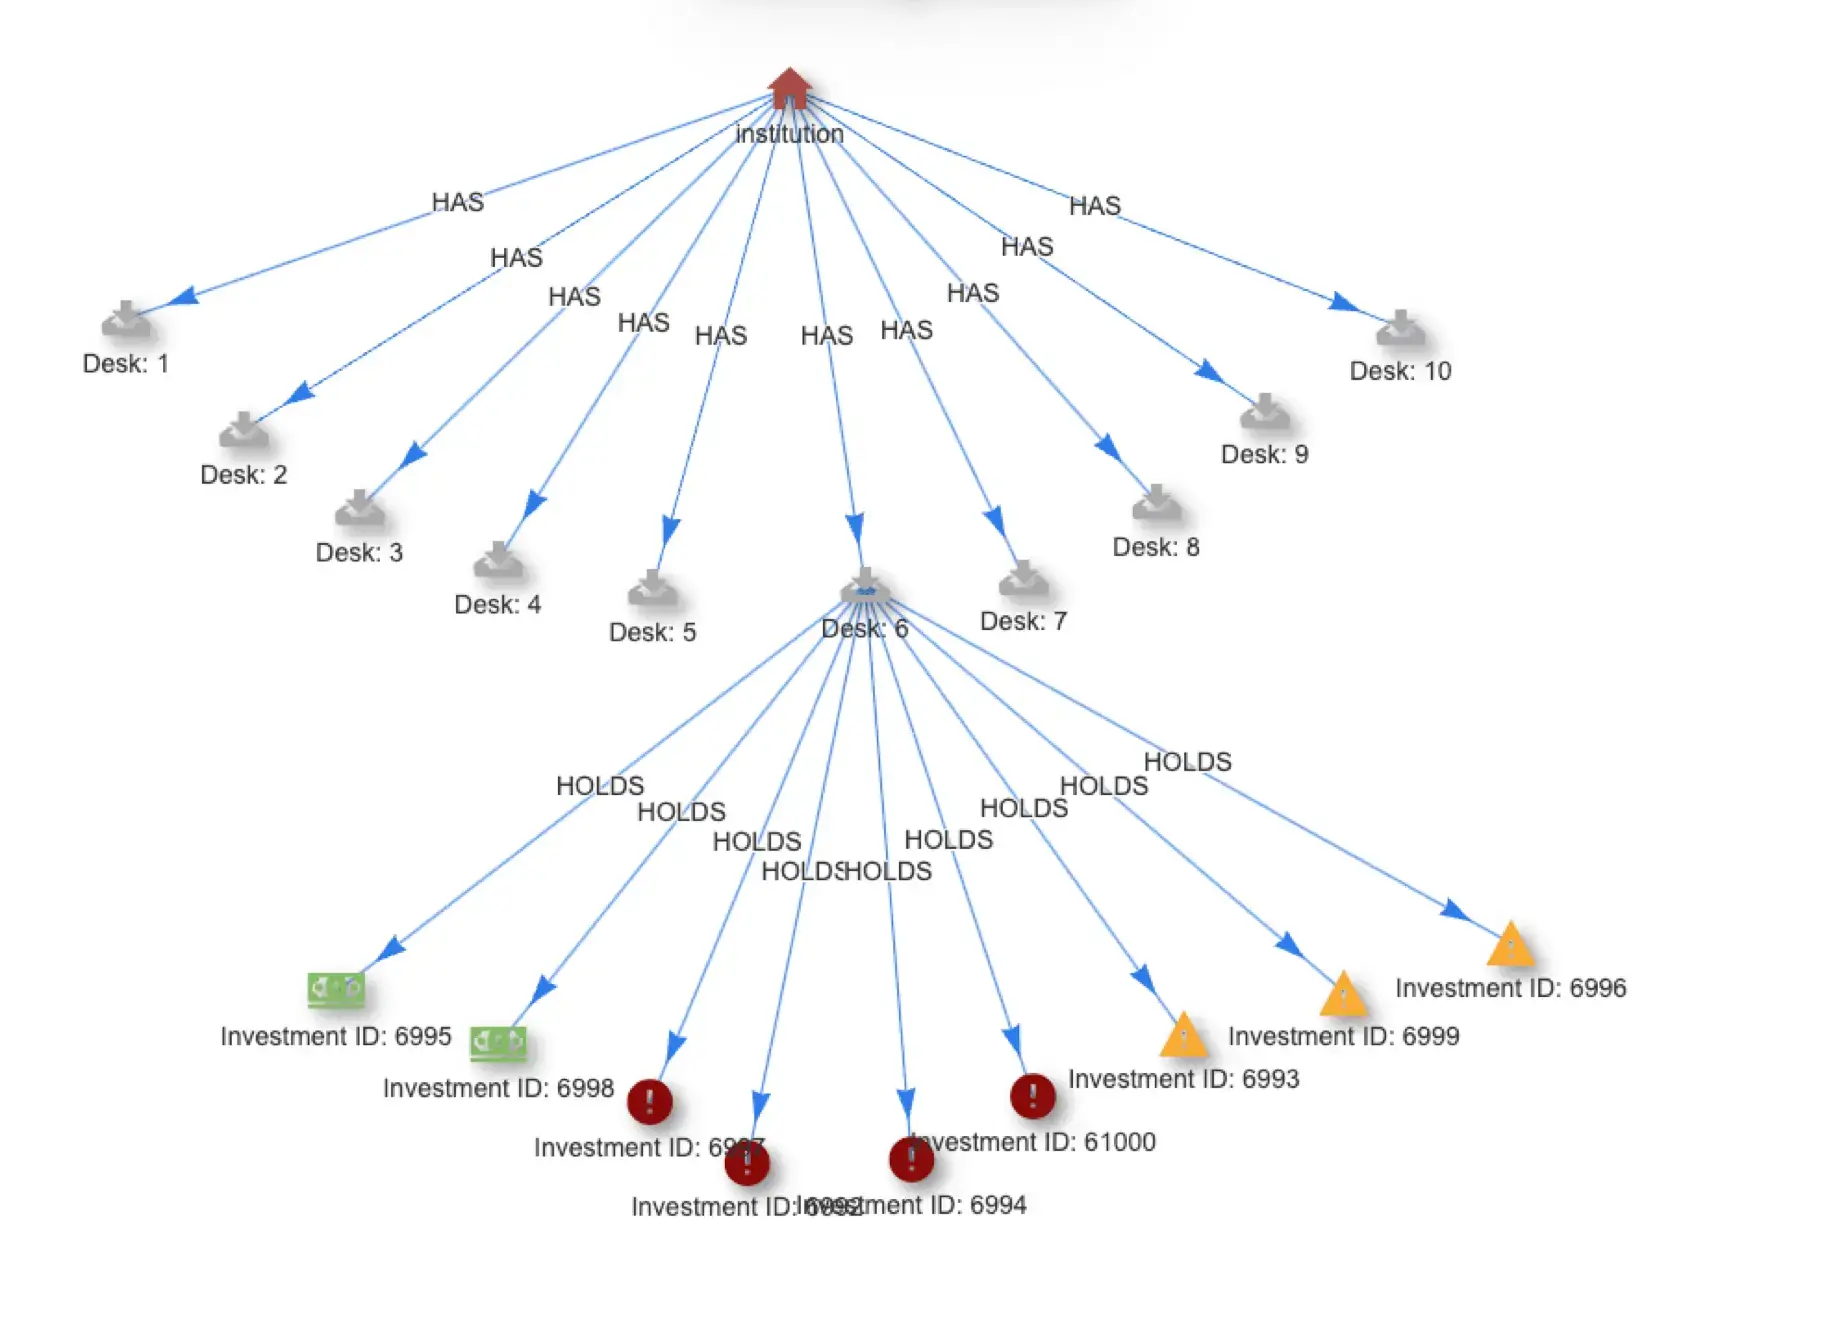
Quine was built specifically to provide enterprises with the ability to process huge volumes of categorical data in real time. Technically speaking, Quine can ingest millions of events per second, render them as a graph that reveals connections between data, and produce actionable insights, all with sub-millisecond latency.
Developers and data scientists query Quine using Cypher, the emerging standard for graph database query languages. Cypher makes it easy to create and detect complex patterns that indicate behaviors. Quine makes it possible to detect those patterns as they are emerging, rather than later, after an event has taken place.
Practically, this is the difference between anticipating and intervening before a customer abandons a shopping cart or an intruder compromises a key system and learning about it later, when you query your data warehouse. Even then, because tools require categorical data to be encoded, predictive analytics may not succeed in detecting an issue, let alone providing enough information to defend against future occurrences.
Drop-in solution for unlocking categorical data
Quine is not just a high-performance graph database. Quine is also a complex event processor designed to consume from and publish to Apache Kafka, AWS Kinesis and SNS/SQS, and Pulsar. Quine designed to work with your existing ETL pipeline.
This minimizes the cost to leverage existing infrastructure to unlock the value contained in unused categorical data.

Quine uses ingest queries to eliminate data silos and combine multiple event sources into a complete graph view.
Standing queries – queries that persist in the graph keeping a lookout for the patterns that matter most to your business – publish results to the next hop in the event stream processing infrastructure the instant a match is made.
What this means in practical terms is that Quine can feed new, categorical data-derived insights into existing workflows, feeding dashboards, alerting analysts, and improving the quality of data that gets stored in company data lakes.
Novelty Detector: Anomaly Detection using Categorical Data
Quine streaming graph is built to drop into your existing infrastructure to look for known patterns across event streams. But what if you don’t know what to look for? How do you deal with new threats or learn new ways to improve customer experience?
Built on Quine, Novelty Detector is unlike previous generations of anomaly detectors. Novelty Detector combines a shallow learning algorithm developed by thatDot with streaming graph’s ability to process categorical data in real time, streaming out only the truly unique and anomalous events.
Because Novelty Detector is a self-training algorithm, it delivers results fast and with no need for data science resources. Data engineers can simply direct data from existing event feeds into Novelty Detector and it will learn what is normal, what is unexpected but not important, and what is truly unique and requires further action.

And just like Quine itself, when a truly unique and anomalous event is detected, Novelty Detector pushes the results to the next hop in the workflow.
Delivering Business Value Categorical Data
Streaming graph is ideal when one or more of the following criteria describe the problem you are trying to solve:
- You need to get answers and take actions on those answers sooner rather than later. Therefore, the delay built into batch processing of data has too high a cost.
- You have high volumes of real-time event data that exceed the capacity of traditional graph databases.
- Your answers to your questions are spread across multiple sources that need to be combined to create a complete picture.
Example use cases vary across a wide range of verticals and use cases, but the examples below should give you a good sense of the breadth of Quine’ streaming graph’s uses:
- Ethereum blockchain fraud detection demo video – (Quine)
- Streaming network monitoring to improve end-user experience (Quine)
- Stopping data exfiltration before it happens (Novelty Detector)
- Pre-processing log files to reduce SIEM and data lake storage costs or de-dupe and data cleanse (Quine)
Return on investment
Unlocking a new source of actionable insight needs to make business sense, which means it should have a measurable impact on outcomes. On the cost side, Quine has demonstrated the ability to scale well past existing graph solutions at extremely reasonable prices – processing 425K events/second for $13/hour on AWS.
Quine is easy to use and is distributed under either an open source or a commercial license that includes support, clustering for horizontal scale and resilience, and access to Novelty Detector.
We are happy to help you with your use case or feel free to explore Quine open source yourself. Either way, you’ll find Quine the fastest, easiest way to unlock the potential of categorical data and deliver incremental business value without massive capital investment.
Banner photo credit: Photo by Dennis Kummer on Unsplash