Two kinds of Data: Categorical and Numerical
Data comes in two flavors: Numeric and Categorical. Numeric data is easy, it’s numbers. Categorical data is everything else.
As the name suggests, categorical data is information that comes in categories—which means each instance of it is distinct from the others.
Names are an example of categorical data, and my name is distinct from your name. On the unlikely chance that your name is the same as mine, I’m sure our government-issued ID numbers, phone numbers, and email addresses are distinct—which are also categorical data.
Examples of Numeric and Categorical Data
| Numeric | Categorical |
| Rate: 27 events/second | Name: Mary Shelley |
| Score: 0.91237 | IP Address: 192.168.1.100 |
| Clicks (counts): 2,743 | File path: C:\Windows\System32\notepad.exe |
| Money: $19.79 | Sentiment: cautiously optimistic |
| Temperature: 72° F | Address: 10 Downing Street |
| Age: 27 years old | Zip code: 97214 |
| Weight: 165 lbs. | Email: info@thatDot.com |
| Distance: 127 miles | Flavor: Umami |
| Location: 45.5209, -122.6778 | Location: 421 SW 6th Avenue, Portland, OR |
| Color: #1f4c7c | Color: blue |
| Angle: 91° | Angle: obtuse |
| Weather: 60% chance of rain | Weather: Partly Cloudy |
| Time: 1617212687 (Unix time) | Time: Wednesday at 10:44 am |
As you can see from the examples at the bottom of this table, some kinds of data can be represented both as numeric data and categorical data. The type of information conveyed is different in each case, but this illustrates that there is often a reasonable relationship or translation between the two.
In fact, many times when a person is trying to use numeric data, they implicitly convert it into categorical data—at least mentally. If I offered to put either $5,000,791 or $5,000,792 into your bank account, you probably wouldn’t spend much time arguing about which deposit should be made.
The amounts are not categorically different. Your brain still says “$5 million.” Their difference doesn’t matter as much as the fact that they are just very big compared to the small $5 you might occasionally find on the sidewalk.
Categorical data is often directly interpretable by humans—and often more of a challenge to interpret with computers. While numeric data is produced by measuring—and you can usually divide them (at least conceptually) into smaller parts as much as you want (remember the plan in Office Space to collect fractions of a penny?)—categorical data is counted or referenced, not measured.
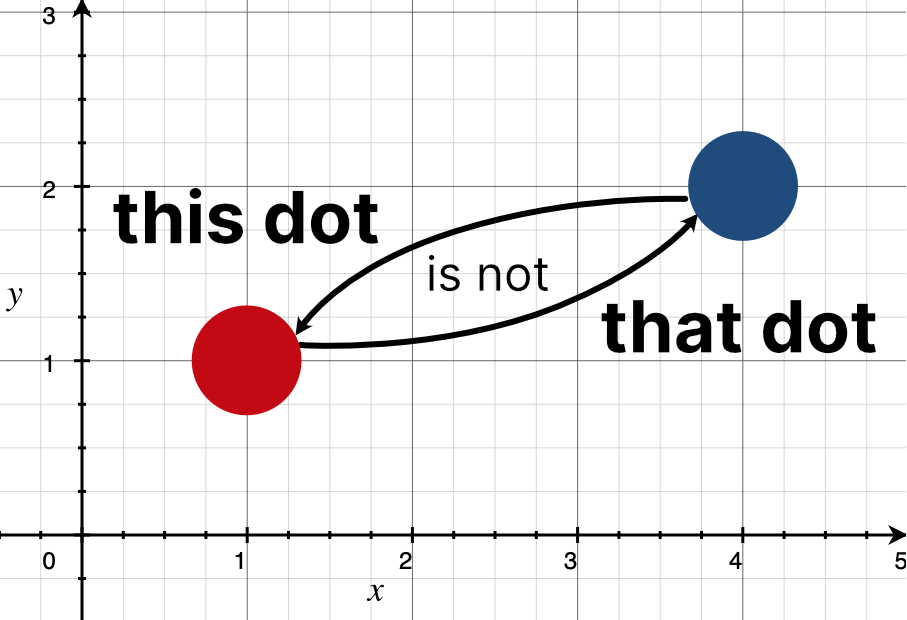
It is often something you can point at or refer to linguistically. Each dot in a plot has a numeric position, but even if two dots have the same position the dots themselves are distinct because “this dot” is not “that dot.” So in short, we might just say that: categorical data is what numeric data is about.
What can you do with categorical data?
Ignore It
Unfortunately, the most common strategy is just to ignore the categorical data. Log data often holds a wealth of information about categorical values, but because of its volume and lack of tooling, most of that data sits unused in log archives on the vague hope that, if a human is ever forced to look at this data by some future algorithm, the human will be able to read the categorical information and understand it directly.
While the numerical data is processed by common analysis tools, the categorical data is ignored in the hope that numeric data happens to contain the answers that will be needed in the future.
Count It
If you don’t ignore categorical data, then by far the most common thing to do with it is to count the values. Entire tech stacks—and even entire companies—have been built around counting how many times each categorical value is seen.
It is often very useful to know how frequent some values are. Rare values can be insightful. Common values can help you understand your data better.
The word-count problem has become the de facto “hello, world” style example when getting started with stream processing tools like in this example from Apache Spark.
Turn it into Numbers
If you try to do something more sophisticated than simple counting, then the next most common approach is to use one of a handful of techniques to try to represent the categorical data as numeric data. While counting is often the domain of data engineers (and much harder and more interesting than it looks), data scientists usually try to reach further; one-hot encoding is the most common technique.
More complex approaches try to “embed” the categorical data into a high-dimensional vector space. If successfully trained, this process will put similar values close to each other, and dissimilar values farther away.
Embedding techniques can accomplish almost miraculous results in some specialized contexts (Word2Vec is still an astounding result, eight years later!), but these techniques require huge amounts of data, expertly trained, in a batch process ahead of time, so they cannot be used on data previously unseen.
Connect It
The hidden value of categorical data lies in its potential relationship to other values. Sophisticated embedding techniques can approximate these relationships, but a more natural approach is to represent the relationships directly.
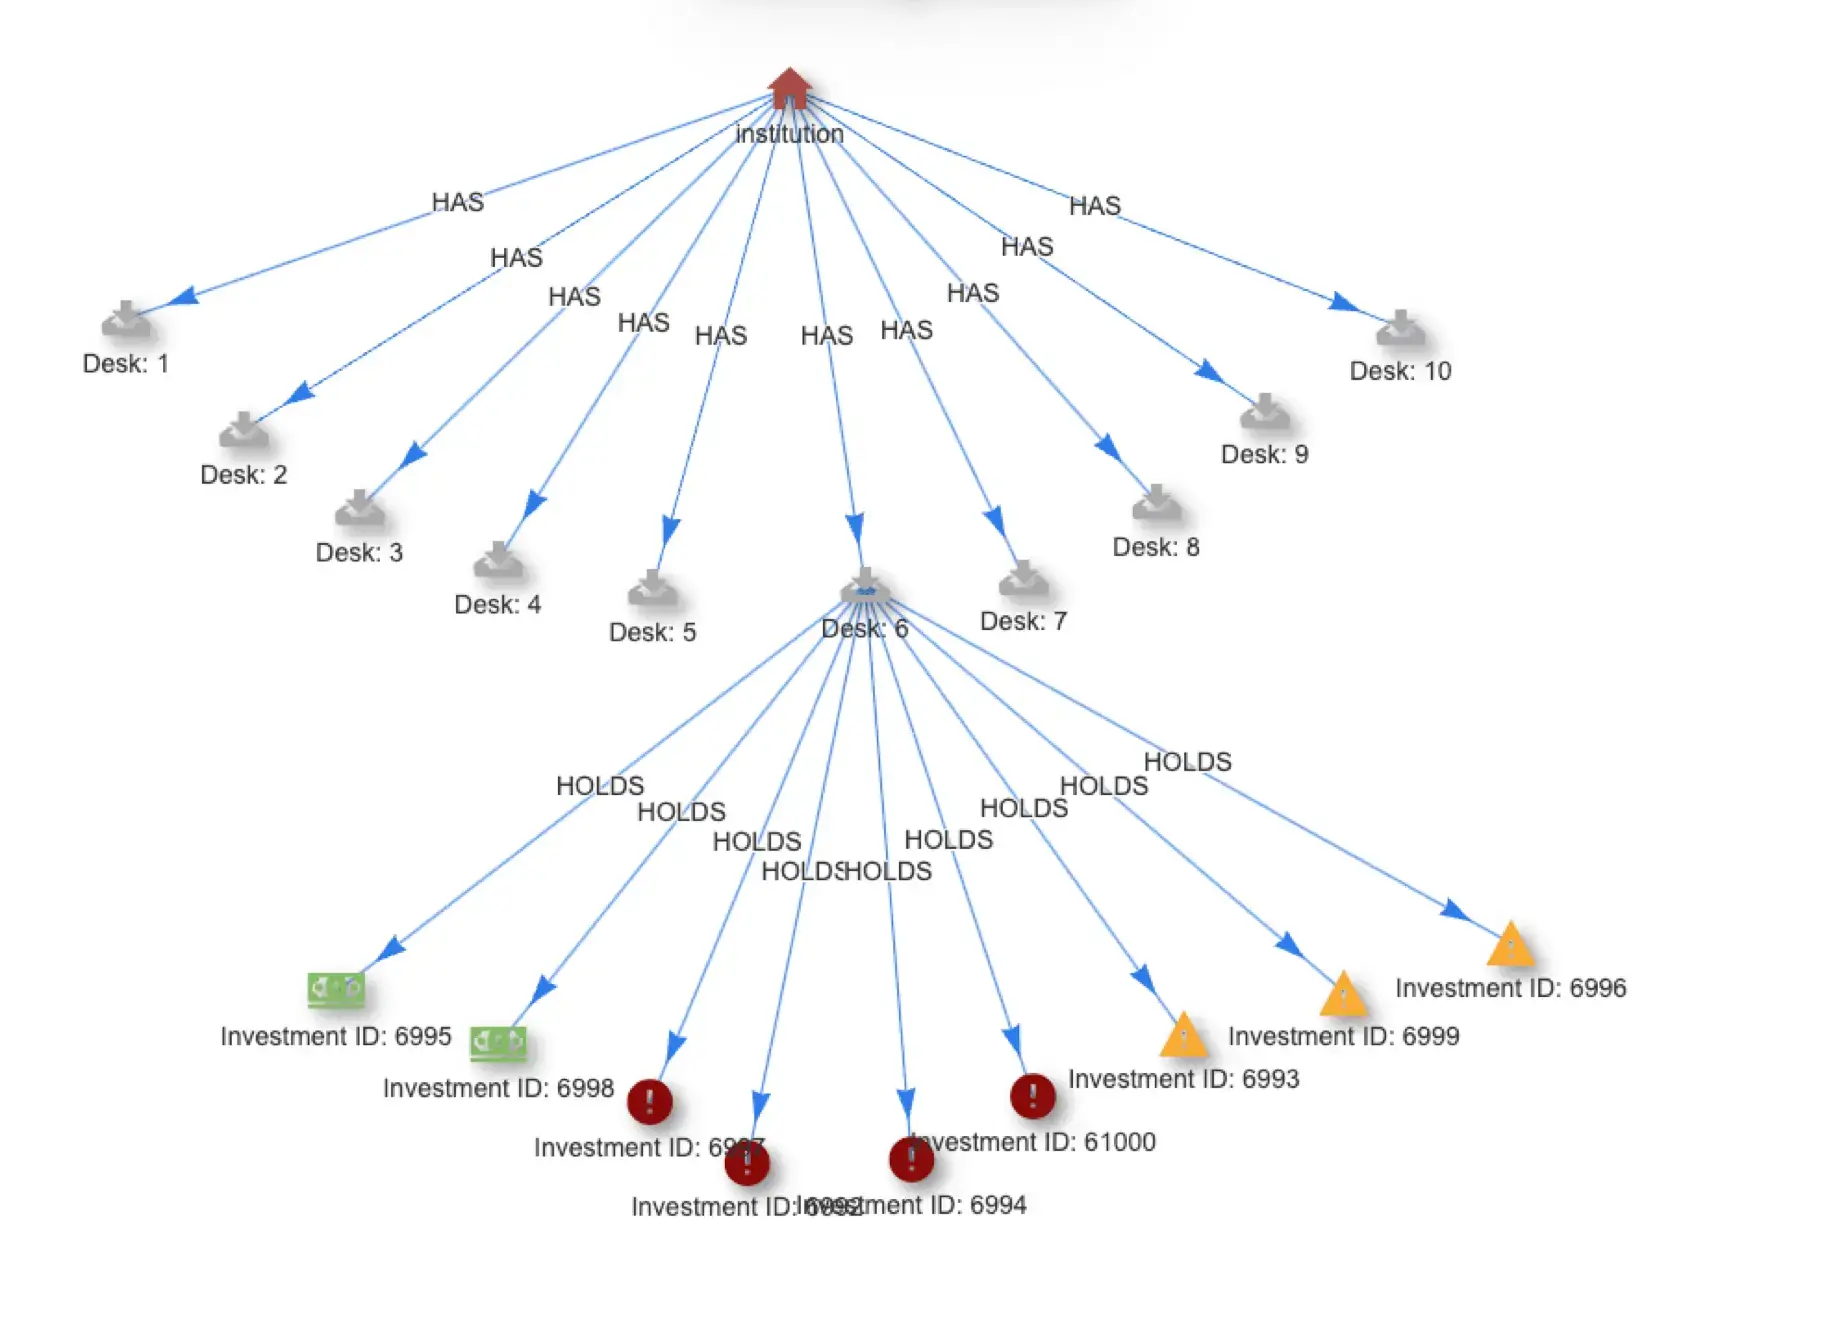
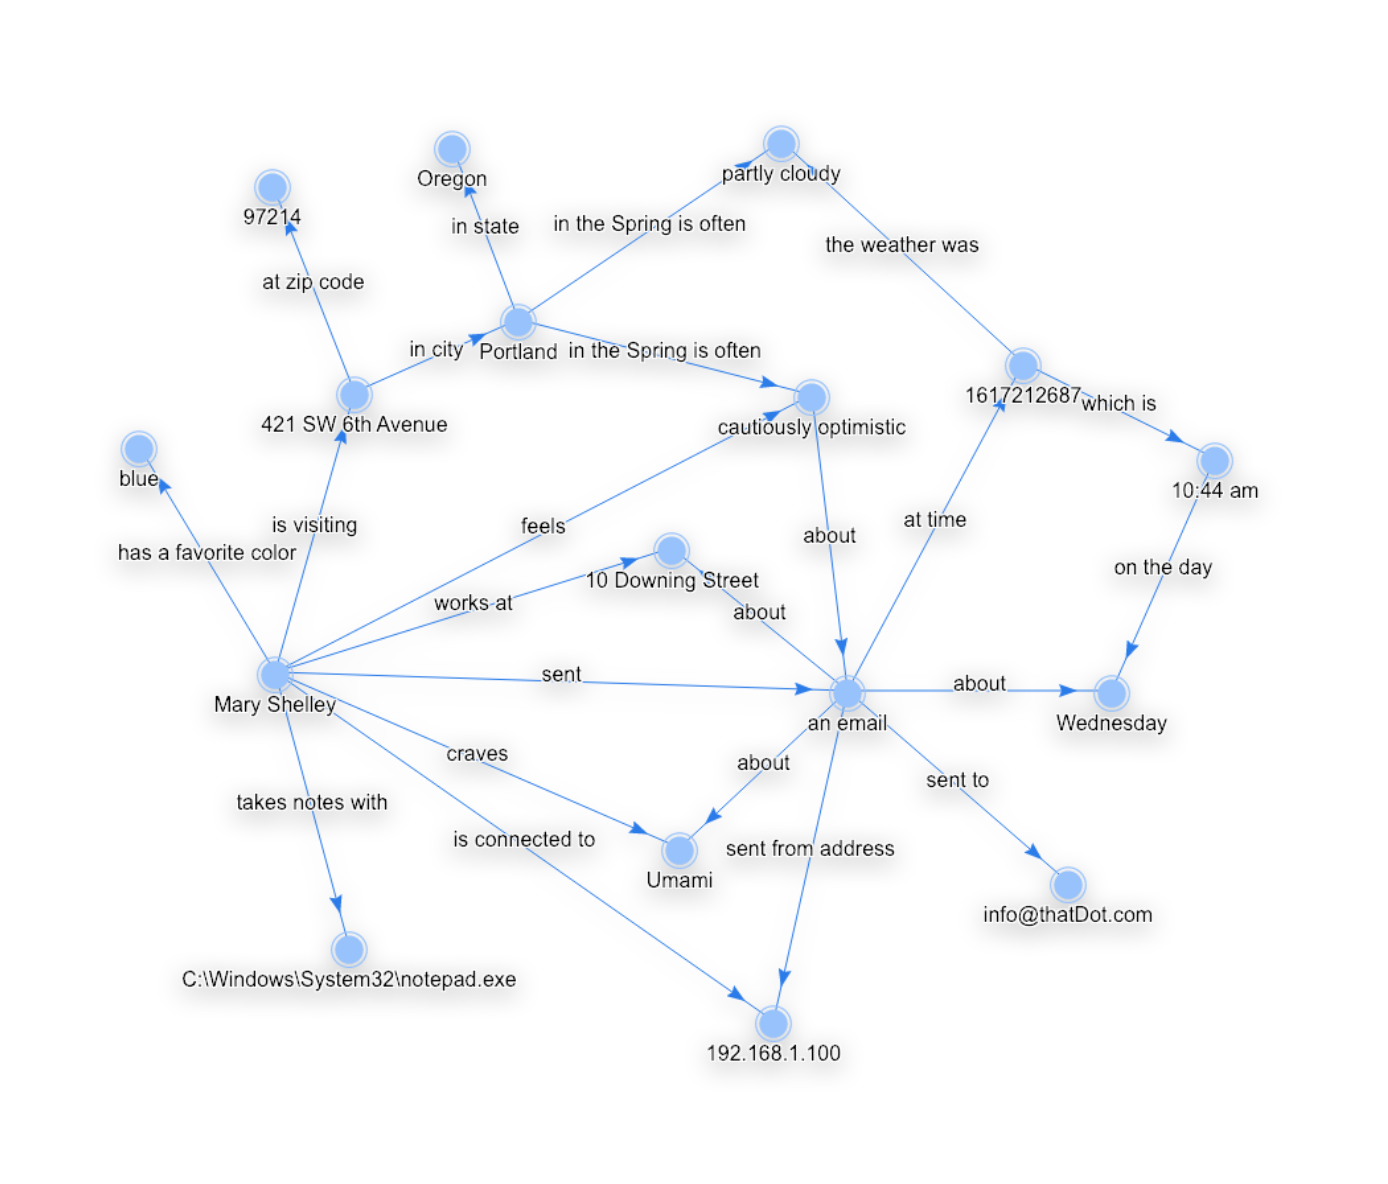
The last 10 years has seen emerging graph technologies that do exactly that. A graph is built of nodes and edges, you can picture this with circles for nodes and arrows for edges.
The Node—Edge—Node pattern connects two categorical values (as nodes) by a relationship represented by the edge.
This is a very natural way to represent data because that Node—Edge—Node pattern corresponds perfectly to the Subject—Predicate—Object pattern at the core of natural language.
With categorical values represented as nodes in a graph, a wealth of information can be represented or discovered by analyzing the structure of that graph.
Knowledge Graphs can concisely represent the domain expertise of large groups, and can lead to new discoveries simply by connecting what we already know.
A connected graph represents the ideal data representation for flexible/schema-less data structures which can also be computed on easily.
Why is it hard to use categorical data?
Bias Toward Numeric Analysis
Analysis tools focus almost exclusively on numeric data. Relationships among categorical values can be profoundly useful, but they are difficult to quantify.
Since they are hard to quantify, it’s hard to show that one analysis is obviously better than another. Graph Theory is a powerful discipline in mathematics focused on exactly that issue, but it is usually only taught at the graduate level and to very few practitioners overall.
As a result, most data analysts and data scientists limit their work to the quantitative tools they studied in statistics. The industry as a whole is very limited in the tools available for working with categorical data.
High Cardinality
“Cardinality” refers to the number of possible values that might occur for a particular category. The cardinality of states in the U.S.A. is fifty.
A value with high cardinality is one where an inconveniently large number of different values show up in the data—like all possible street addresses in the U.S.A.
High cardinality becomes a challenge for some of the strategies mentioned above—like counting—because high cardinality requires maintaining a very large number of counters.
When you are interested in the relationship between multiple values with high cardinality, that usually means maintaining separate counters for every possible combination of values. The size and complexity of this approach spirals out of control very quickly with high cardinality data!
A related challenge for working with high-cardinality categorical data is when you don’t know all possible values ahead of time.
You might call this a problem of “increasing cardinality.” Almost all of the tools for turning categorical values into numbers (like one-hot encoding and embedding techniques) require a fixed set of possible values, known in advance. These tools are not able to represent data they have never seen.
How can we better use categorical data?
Depending on the organization, the first step is to stop ignoring categorical data and start making use of it. More than half of the data collected by enterprise companies is never used! It’s collected, stored, and paid for… but never used.
Most of that unused data is categorical and can contain critical information to solve otherwise intractable problems. The tendency to ignore categorical data and instead use numeric data simply because current tools are built for numbers leaves many problems unsolved.
The industry behaves like the drunk person looking for their keys under a lamppost because that’s where the light is.
Our Tools Need to Evolve
The development of graph databases over the last 10 years has been a major step forward in making use of categorical data. Tools like Neo4j have blazed this trail and proven the value of the graph model for getting to value in small categorical datasets.
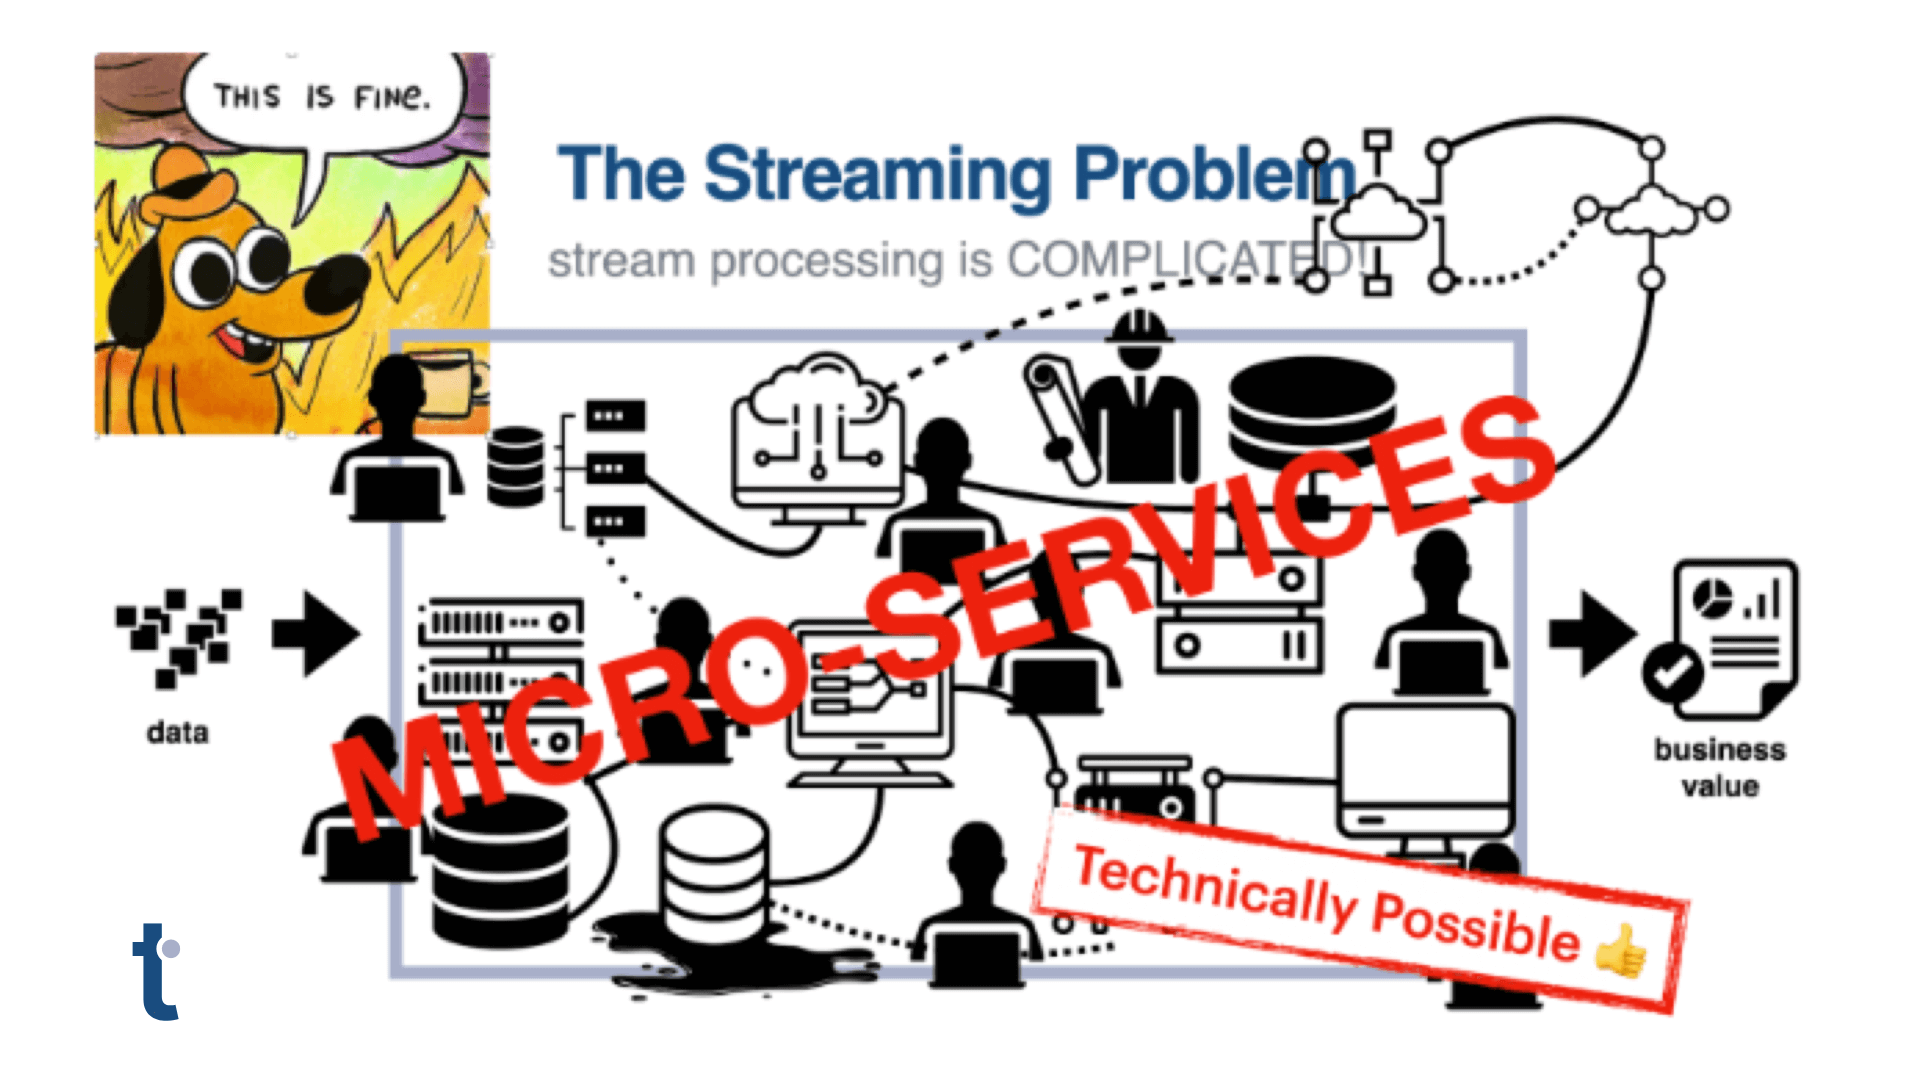
As the world moves inexorably toward high-volume and real-time stream processing, this powerful graph data model needs to be supported by the next generation of high-volume stream processing tools.
Apache Kafka is an incredibly powerful tool for delivering event streams, and tools like Quine are being used to join those event streams together and process them through a streaming graph engine to produce a more intelligent real-time stream as output.
Categorical data is also proving to be the long-elusive key to improving anomaly detection in challenging domains like cybersecurity. Our company has developed a streaming novelty detector for categorical data which is able to produce real-time novelty scores, assessments, and explanations through behavioral fingerprinting.
This system has been shown to accurately assess the novelty of categorical data in cybersecurity event streams and reduce false positives by 99%.
The next generation of streaming data tools are making categorical data more accessible and usable. This long-neglected and underused class of data is already being collected by virtually all enterprise companies. It’s only now that the tools for using this data to solve challenging problems are becoming available.