Adding Capabilities to Novelty Detector
Since the launch of thatDot’s real-time Novelty Detector for Categorical data in November, we have received numerous feature requests for additional data exploration and data transformation capabilities. We are excited to announce the addition of these key functions in the latest release, available now from AWS Marketplace.
Data Exploration Capabilities:
While the primary output of thatDot Novelty Detector is our Novelty Score API response payload, numerous users shared that they found value in the data exploration tools we use in our demos. This is especially useful when iterating on new use cases or digging into the details of specific anomaly events. To better support these requirements we have added the following to Novelty Detector.
Data Distribution Plots
Data Distribution Plots are a sampled view of API responses that provide visual insight into score distribution and rapid identification of your most anomalous observations. Plots combine Sequence, Novelty Scores, Uniqueness Scores, and score distribution and display different ranges of observations, including long term history, recent observations and high-scoring events.
Plots feature significant interactivity, including continuous updates with new observations, drill-down to smaller data populations, and click-through to any single observation. Lastly, the entire Plots page can be rendered for each anomaly context you have configured in thatDot Novelty Detector.
Example Data Distribution Plot

Observation Detail Visualizations
Observation Detail Visualizations are used to discover “why” an observation has been scored as it was, revealing the root cause of a score. They are accessed by clicking on any data point in your Data Distribution Plots, or by querying for the sequence number of a particular observation directly in the thatDot Discovery UI. Observation details show the relational context of each data element in the observation and a count of the number of times that value has been observed in the context of the data element preceding it. Clicking on any data element allows you to expand the tree to see the range of values observed in the data set.
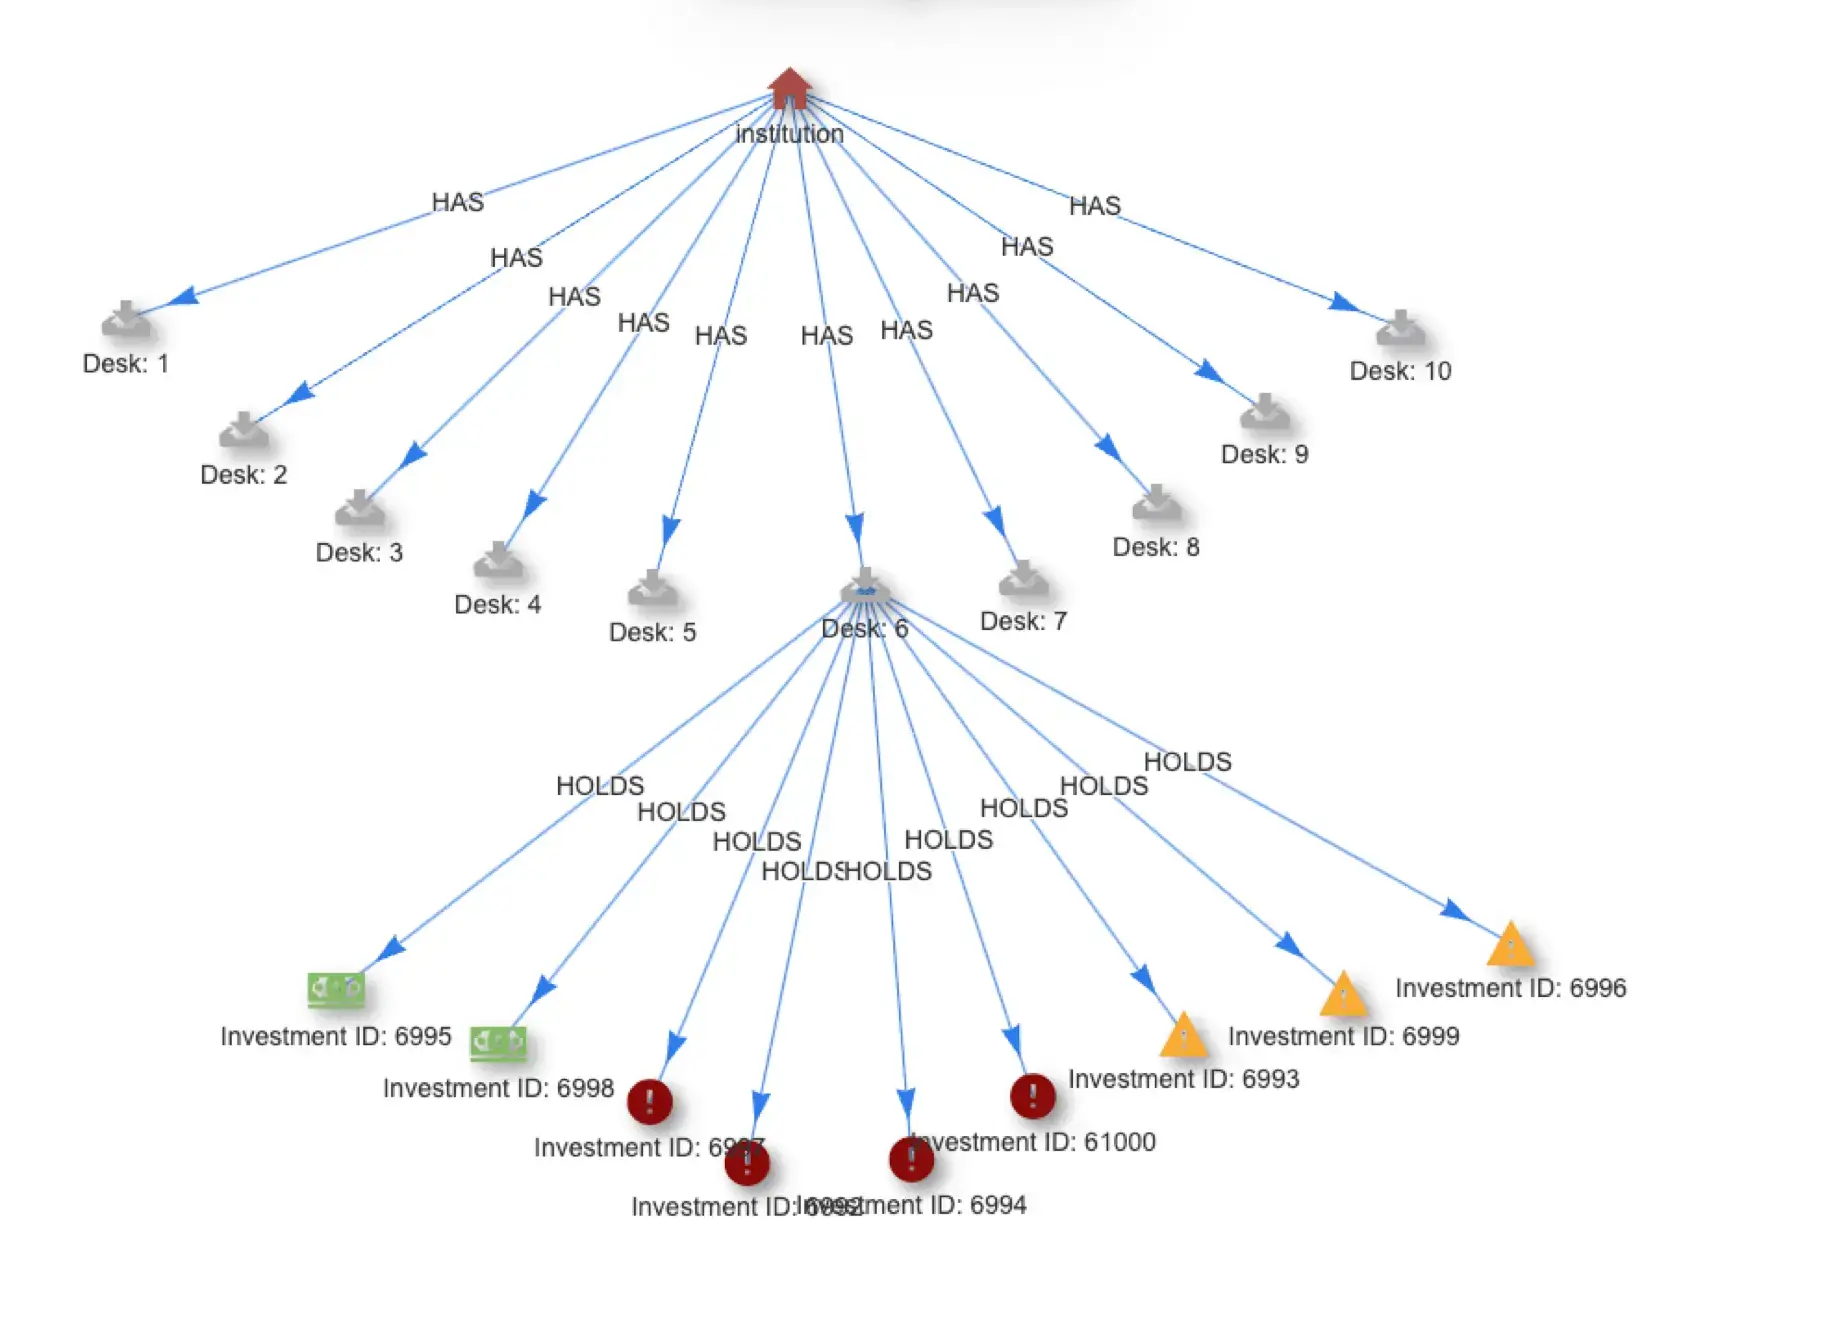
Example Observation Detail Visualization

Data Transformation Functions:
Quickly transforming or reordering data elements to experiment and refine your anomaly detection efforts was a top request by users. We are excited to share that users may now define data transformations using javascript, removing the need for external data preprocessing and allowing rapid iteration of new anomaly detection scenarios.
Available to all users, the data transformation API supports a range of operations that can be applied against both batch and streaming data.
- Decomposing strings into components, which is particularly useful for decomposing directory paths or user agents
- Concatenation of fields into a single aggregate value
- Encoding numerical values as strings, such as converting metrics into good/poor/bad buckets or turning timestamps into day time descriptions such as morning, mid-day, evening and night
- Data filtering to remove data not needed for your model
- Data obfuscation including data hashing or masking
- Data reordering to assess the impact of different data contexts
thatDot’s built-in Data Transformation Functions allow users to rapidly modify their observations, greatly increasing the pace of model testing and iteration.
We at thatDot are excited to share these new updates with you and welcome additional feedback and feature requests. As noted above, the latest release of thatDot Novelty Detector for Categorical Data is available now from AWS Marketplace or you can contact thatDot.com for a demo.
thatDot Novelty Detector
thatDot Novelty Detector is the first general-use application designed for finding anomalies in real-time in data sets that include categorical data. Available as an application for deployment in any cloud or data center thatDot Novelty Detector exposes an API that scores submitted observations for their “novelty” enabling real-time anomaly detention with fewer false positives than traditional threshold based metric analysis.