Quine adds Real-time ETL for Kafka-based Event Streams
Kafka is the tool of choice for data engineers when building streaming data pipelines. Adding Quine into a Kafka-centric data pipeline is the perfect way to introduce streaming analytics to the mix. Adding business logic directly into an event pipeline allows you to process high-value insights in real time. Quine also allows you to add processing of categorical data, which makes up a vast majority of the data your business generates, yet is often overlooked or discarded.
Simple Streaming Pipeline for ETL
Consider this straightforward, minimum viable streaming pipeline.
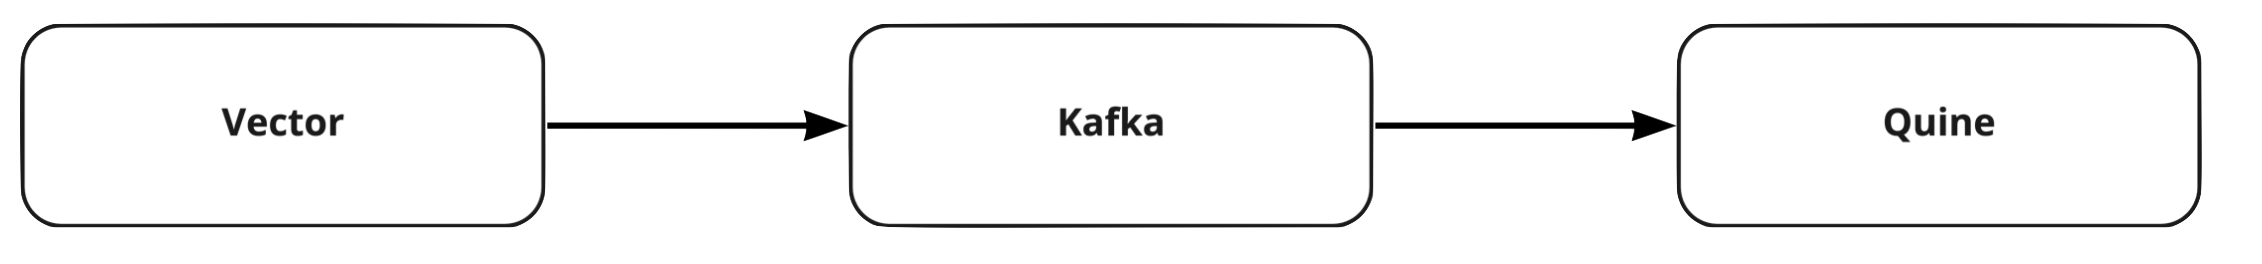
A simple streaming pipeline with Quine ingesting Kafka streaming data
In this simple pipeline, Vector will produce events (dummy_log lines) once a second and stream them into a Kafka topic (demo-logs) where an ingest stream from Quine will transform the log events into a streaming graph.
Setting up Vector
Start by installing Vector in your environment. My examples use macOS and may need slight modifications to work correctly in your environment. I installed Vector with brew install vector, which includes a sample Vector.toml config in /opt/homebrew/etc/vector. I extended the sample Vector config to build our pipeline.
Run Vector to get a feel for the events that Vector emits.
❯ vector -c /opt/homebrew/etc/vector/vector.toml
Vector generates dummy log lines from a built-in demo_logs source. The log lines are transformed in Vector using the parse_syslog and emit a JSON object.
{
   "appname": "Karimmove",
   "facility": "lpr",
   "hostname": "some.com",
   "message": "Take a breath, let it go, walk away",
   "msgid": "ID416",
   "procid": 9207,
   "severity": "debug",
   "timestamp": "2022-06-14T15:34:11.936Z",
   "version": 2
}
Once Vector is emitting log entries, we need to connect that output to Kafka by adding in a Kafka sink element into the Vector.toml file.
# Stream parsed logs to kafka
[sinks.to_kafka]
type = "kafka"
inputs = [ "parse_logs" ]
bootstrap_servers = "127.0.0.1:9092"
key_field = "quine"
topic = "demo-logs"
encoding = "json"
compression = "none"
Local Kafka Instance to use with Quine
Kafka is the next step in the pipeline. I set up a single node Kafka cluster in Docker. There are more than enough examples on the internet of how to set up a Kafka cluster in Docker, and please set up the cluster in a way that fits your environment. My cluster uses a docker-compose file that launches version 7.1.1 of Zookeeper and Kafka containers.
Start the Kafka cluster and create a topic called demo-logs.
Note
I had to run the docker compose up command a couple of times before both the Zookeeper and Kafka containers launched cleanly. Make sure the containers fully load at least once before including the -d option to run them in detached mode.
❯ Docker compose up -d
❯ docker exec Kafka Kafka-topics --bootstrap-server kafka:9092 --create --topic demo-logs
Use kcat to verify the Kafka cluster is up and that the demo-logs topic was configured.
Quine Config
Ok, let’s get Quine configured and ready to receive the log events from Kafka via an ingest stream. We can start with a simple ingest stream that takes each demo log line and creates a node.
ingestStreams:
  - type: KafkaIngest
    topics:
      - demo-logs
    bootstrapServers: localhost:9092
    format:
      type: CypherJson
      query: |-
        MATCH (n)
        WHERE id(n) = idFrom($that)
        SET n.line = $that
Launch the Pipeline
Let’s launch Vector and Quine to get the pipeline moving.
Launch Vector using the modified vector.toml configuration.
❯ vector -c vector.toml
Launch Quine by running the Kafka Pipeline recipe.
❯ java -jar quine-x.x.x -r kafka_pipeline.yaml
And verify that we see nodes generated in Quine.
Quine app web server available at http://0.0.0.0:8080

| => INGEST-1 status is running and ingested 18
Congratulations! 🎉 Your pipeline is operating!
Improving the Ingest Query
The ingest query that I started with is pretty basic. Using CALL recentNodes(1), let’s take a look at the newest node in the graph and see what the query produced.
❯ ## Get Latest Node
curl -s -X "POST" "http://0.0.0.0:8080/api/v1/query/cypher" \
     -H 'Content-Type: text/plain' \
     -d "CALL recentNodes(1)" \
| jq '.'
{
  "columns": [
    "node"
  ],
  "results": [
    [
      {
        "id": "9fde7ef4-c5ec-35f1-ae5f-619bd9ab7d5c",
        "labels": [],
        "properties": {
          "line": {
            "appname": "benefritz",
            "facility": "uucp",
            "hostname": "make.de",
            "message": "#hugops to everyone who has to deal with this",
            "msgid": "ID873",
            "procid": 871,
            "severity": "emerg",
            "timestamp": "2022-06-14T19:58:16.463Z",
            "version": 1
          }
        }
      }
    ]
  ]
}
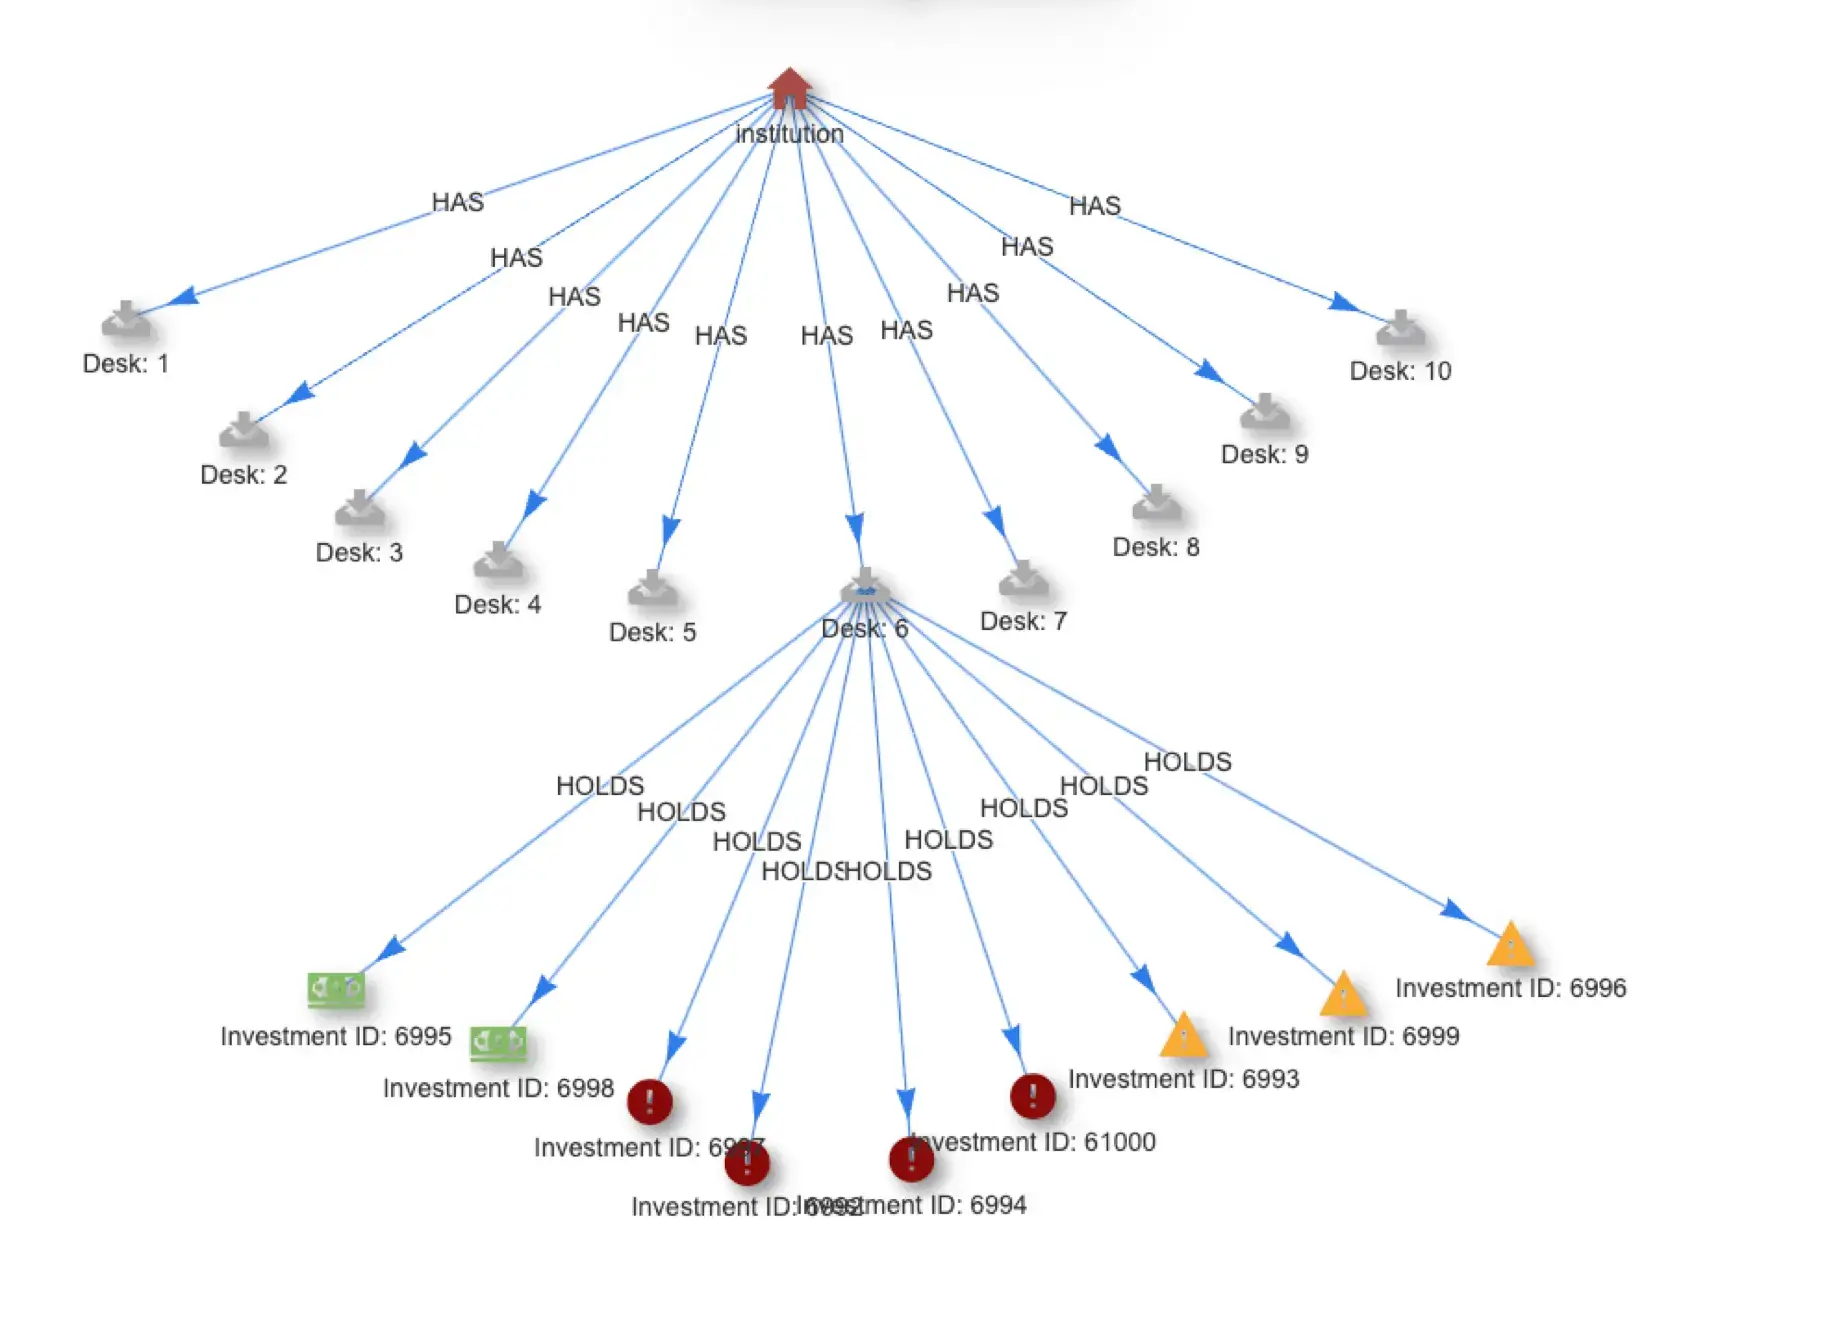
The ingest query creates nodes using idFrom(), populated them with the properties that it received from Kafka, and didn’t create any relationships. We can make this node more useful by giving it a label and removing parameters that are not interesting to us. Additionally, using reify.time(), I can associate the node with a timeNode to stitch together events that occur across the network in time.
Analyzing the sample data
Quine has a web-based graph explorer that really comes to life once you have a handle on the shape of the streaming data. But I am starting from the beginning with a bare-bones recipe. For me, when I start pulling apart a stream of data, I find that using the API to ask a few analytical questions serves me well.
I’ll use the /query/cypher endpoint to get a feel for the shape of the sample data streaming from Kafka. I don’t recommend doing a full node scan on a mature streaming graph, but my streaming graph is still young and small.
Using my REST API client of choice, I POST a Cypher query that returns the metrics (counts) for parameters that are interesting.

That’s a lot of JSON results to review; let’s take this over to a Jupyter Notebook to continue the analysis. My REST API client includes a Python snip-it tool that makes it really easy to move directly into code without having to start from scratch.

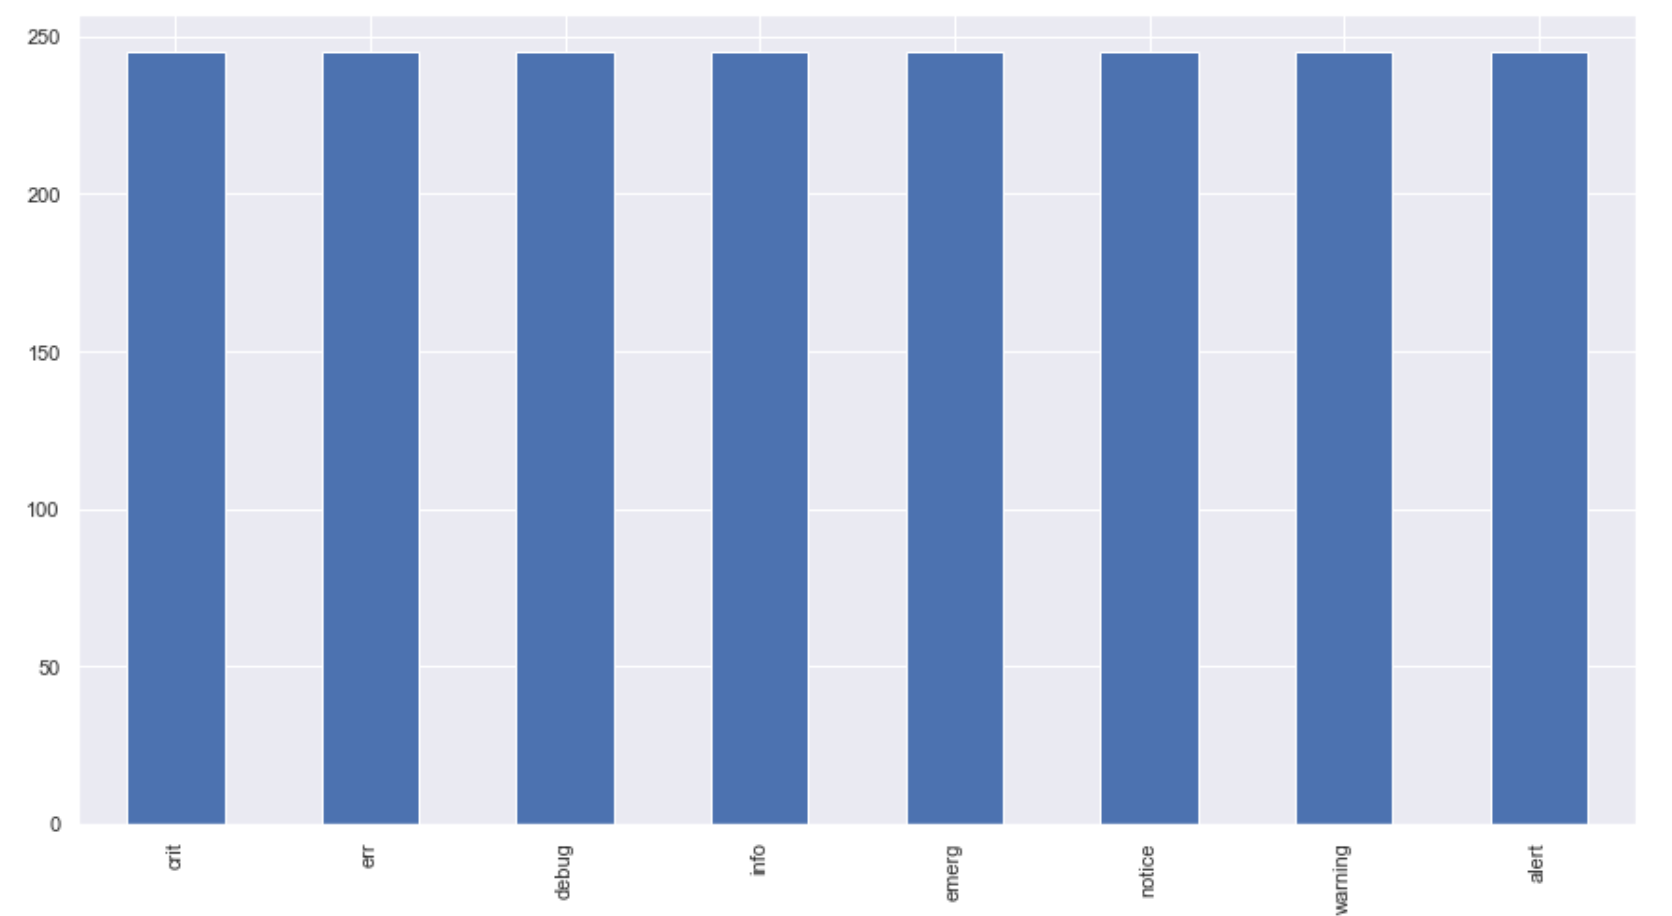
In Jupyter, within a few cells, I had the JSON response data loaded into a Pandas DataFrame and an easy to review textual visualization of what the sample data contains.
I let the pipeline run while I developed simple visualizations of the metrics. Right away, I could see that the sample data Vector produces is random and uniformly distributed across all of the parameters in the graph. And after 15000 log lines, the sample generation exhausted all permutations of the data.
Conclusions and Next Steps
I learned a lot about streaming data while setting up this pipeline. Vector is a great tool that allows you to stream log files into Kafka for analysis. Add a Quine instance on the other side of Kafka, and you are able to perform streaming analytics inside a streaming graph using standing queries.
- Use the same workflow to develop an understanding of streaming data that you do for data at rest
- Perform streaming analysis by connecting Quine to your Kafka cluster
- Use Cypher ingest queries to form the graph within a Quine ingest stream.
Quine is open source if you want to run this analysis for yourself. Download a precompiled version or build it yourself from the codebase Quine Github. I published the recipe that I developed at https://quine.io/recipes.
Have a question, suggestion, or improvement? I welcome your feedback! Please drop into Quine Slack and let me know. I’m always happy to discuss Quine or answer questions.
Further Reading
And if you’re interested in learning more about building a streaming graph from various ingest sources., check out previous installments in this blog series:
- Building a Quine Streaming Graph: Ingest Streams
- Ingesting data from the internet into Quine Streaming Graph
- Ingesting From Multiple Data Sources into Quine Streaming Graph
- Ingest and Analyze Log Files Using Streaming Graph