Data analysis based on Indicators of Behavior (or IoBs) has emerged as the new standard in real-time cybersecurity threat hunting. As data science practices and tooling have evolved to enable IoB analysis, we are finding that the identification of system and/or user behavior patterns, especially in real-time, extends beyond the cybersecurity domain to finance, e-commerce, and in particular, Internet of Things (IoT) use cases.
The Shift to Critical IoT Data
Self-driving cars, medical devices, and security monitoring are just a few examples of how IoT solutions are being applied to high stakes or critical use cases. As we leverage IoT for higher value use cases, it becomes apparent that they benefit enormously from real-time data analysis.
Data from last week, yesterday, last night, or even an hour ago, doesn’t help achieve satisfactory outcomes when you’re using data to assist in navigating a car traveling 100 km/hr or monitoring an at-risk patient outside a closely monitored hospital setting. As IoT devices handle more critical operations we need more effective tools for monitoring, securing, and interpreting this data in real time.
IoT Data Challenges
A hallmark characteristic of IoT devices is their significant resource limitations: everything from processing power and storage to connectivity has historically been in short supply.
The variability of natural environments, difficulty in upgrading firmware remotely, and intermittent communications compound the difficulty to manage networks of IoT devices in the way we’ve come to expect we can manage other large networks of connected devices..
Fortunately, thanks to LTE/5G and Moore’s law, IoT devices large and small increasingly have the resources to generate, process, and transmit more substantive data.
The High Cost of Slow Data
But this ramp up in the capacity of large numbers of connected devices just relocates the problem of processing data to the other end of the IoT network: to the data processing infrastructure.
As data floods in, systems designed for intermittent trickles either can’t scale, cost too much, or, in an effort to solve both scale and cost, process data only in batches.
When you add together the cost of proprietary device management software (licensing can cost as much as $1M/100,000 sensors) and data processing and storage infrastructure (e.g. SIEMs like Splunk are notoriously expensive), it is difficult to make a business case that supports the capital investment necessary to adopt and deploy IoT technology.
Batch processing limited event data means opportunity costs.
And while batch processing is fine for many tasks, finding and acting on sensor information when it can make a positive business impact doesn’t work if that data is processed only after it is too late to take action. Which begs the question: if use cases like preventative maintenance were the primary selling points of IoT, what’s the point?
IoT is finally ready for IoB
With more robust IoT devices collecting and transmitting richer data sets, there is now opportunity to apply real-time IoB detection and the threat detection and operational analysis it can deliver. With IoBs, security teams can watch for patterns of system and user behavior that indicate a notable event (cyber attack, upsell opportunity, or churn risk) is in process, rather than waiting to find evidence after the fact.
When watching for IoBs , teams can build predictive models that limit negative impacts and capitalize on opportunities. As we look at increasingly complex IoT data we can apply this next generation of thinking to build state of the art analysis that improves the confidence and timeliness of IoT data analysis.
Applying IoB Analysis to IoT Data
As I described in my recent blog on the use of IoBs in modern Cyber Security Threat Hunting, IoBs draw upon the context of system and user behavior to more reliably identify attack threats. IoBs can as easily be applied to the behavior of “an about to fail” disc brake or “trending towards failure” heart valve. Importantly, the richer context behavior analysis provides significantly fewer false positives than traditional analysis due to the added context provided by analyzing categorical data elements used to describe behaviors.
Comparing Legacy Batch Processing of Metrics with Real-time IoB Analysis
Monitoring Use Cases
1. Delivery Truck Monitoring
- Traditional Metrics Example (batch):
- Hourly or daily metrics on vehicle speed, idle time, and brake application.
- IoB Analytics Example (real time):
- By driver, identify patterns of rapid acceleration, turns, and braking indicating aggressive driving or an accident.
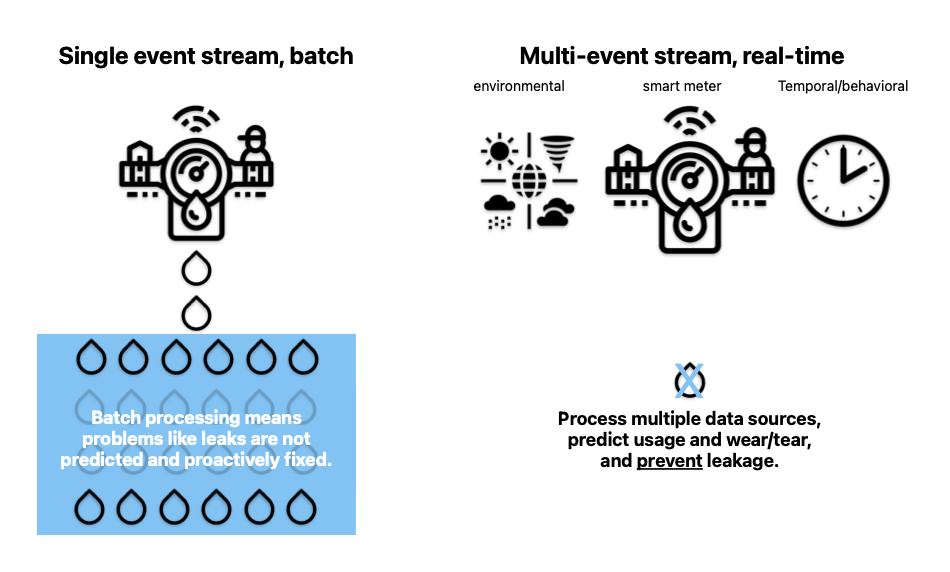
2. Utility Meter Monitoring
- Traditional Metrics Example (batch):
- Daily or even monthly batch analysis of usage to identify potential leaks or resource theft.
- IoB Analytics Example (real time):
- Real-time inputs for predictive modeling of shortages to avoid brownouts or identify leaks.
3. Device Security Monitoring
- Traditional Metrics Example (batch):
- Periodic metrics that report login attempts, source IP, time of day, bytes transferred.
- IoB Analytics Example (real time):
- Identify patterns of login success and failures, based on source IPs at different times of day over an extended time period.
4. Medical Device Monitoring
- Traditional Metrics Example (batch):
- Periodic metrics on patient temperature, glucose, heart rate, respiration.
- IoB Analytics Example (real time):
- Identify patterns of vital signs at different hours of the day to alert on deviations from expected patterns.
IoB Analysis Requires New Tools
The evolution from reactive batch processing of data to a real-time IoB-based approach requires a new set of technical capabilities along with the tools to deliver them. At minimum, a system must be able to:
- Easily combine streams of real-time and historical data.
- Process both categorical and numerical variety.
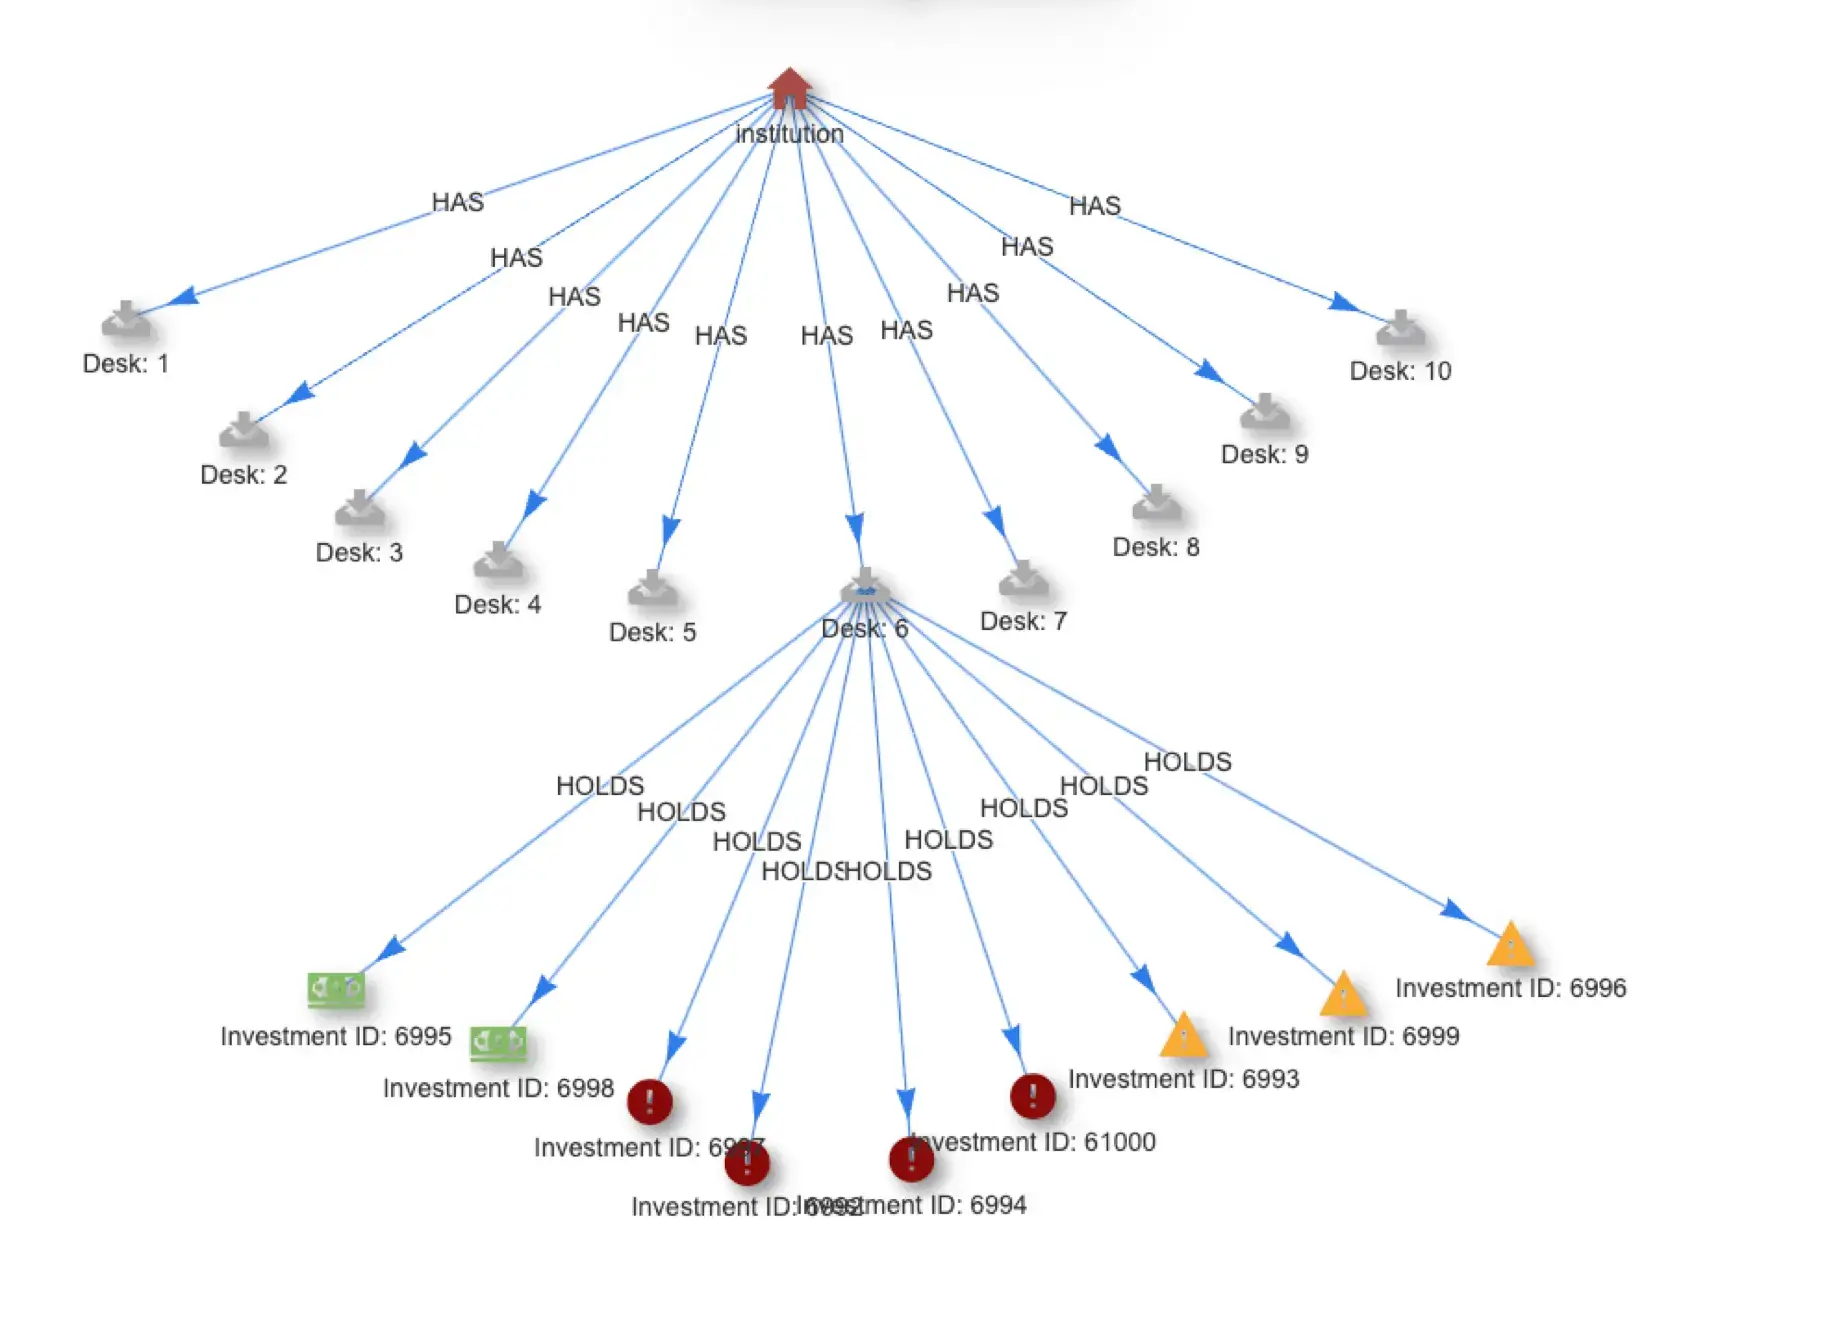
- Recognize and act on known patterns within this combination of categorical and numerical data, which typically requires a graph database or system that uses graph’s connected data structures.
- Continuously analyze the constant flows of data for emerging behaviors, whether they signal threats or opportunities.
- Update the system with newly identified threats and grow the number of IoBs for which to monitor.
The advent of ground-breaking streaming graph technology has emerged to meet the need: thatDot’s Quine streaming graph and Novelty Detector. thatDot’s open source Quine streaming graph aligns with the requirement to ingest multiple data streams of both categorical and numerical data.
In fact, because it is a graph data processor, Quine is the only real-time event processor that works natively with categorical data, which makes it much easier to express IoBs as patterns. Because of Quine’s unique architecture, it can monitor streams for IoBs, detect their fingerprint patterns the instant they occur, and take immediate action, often in the form of predefined business rules or remediations. The work flow looks as follow:
- Event sources are ingested from any common event stream queue, including Apache Kafka, AWS Kinesis, AWS SQS, or Apache Pulsar/DataStax Astra Streaming.
- IoBs are defined in Quine as standing queries, the watchdog queries that monitor the streams for important patterns.
- Quine analyzes newly arriving events for matches against IoB pattern definitions. Partial matches are identified and stored for any desired period of time to watch for behaviors that occur incrementally over longer time frames.
- When Quine detects a full IoB pattern match, it generates a new event that is associated with a pre-defined set of business rules: sending alerts to a SOC or passing an upsell offer to a user are a few examples.
- All data is also passed through Novelty Detector, a real-time shallow learning algorithm that identifies novel and notable behaviors that can be turned into IoBs if deemed necessary.
The data flow looks like this:
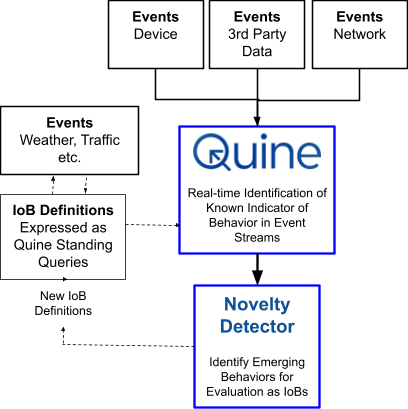
The modern IoB workflow using Quine Enterprise.
Streaming Graph Delivers End-To-End IoBs for IoT
Quine is available in both open source and enterprise editions. However, Novelty Detector is available either in the AWS marketplace or under license as part of thatDot Streaming Graph. Streaming Graph offers large organizations and connected device manufacturers both the clustered, resilient version of Quine and Novelty Detector. It is meant for production applications where resilience, query performance, and throughput matter. Resilient clustering includes support for hot spares and distribution across multiple availability zones. We recently shared reproducible tests demonstrating both scale (thatDot Streaming Graph easily processed one million 4-node graph events/second) and resilience in the face of node failure. You can read about the tests here.
Try It Yourself
If you want to try it on your own, here are some resources to help:
- Download Quine – JAR file | Docker Image | Github
- Check out the Ingest Data into Quine blog series covering everything from ingest from Kafka to ingesting .CSV data
- Novelty Detector for Log Analysis – learn more about Novelty Detector in this blog showing how to use it to analyze system logs to detect novel anomalous behavior.
Original photo for header by Sander Weeteling on Unsplash