The Hidden Cost of Batch Processing for Financial Institutions
The recent failures at financial institutions like First Republic Bank, Signature Bank, and even Silicon Valley Bank have brought issues of regulatory compliance and capital management to the forefront for both industry members and the wider public alike.
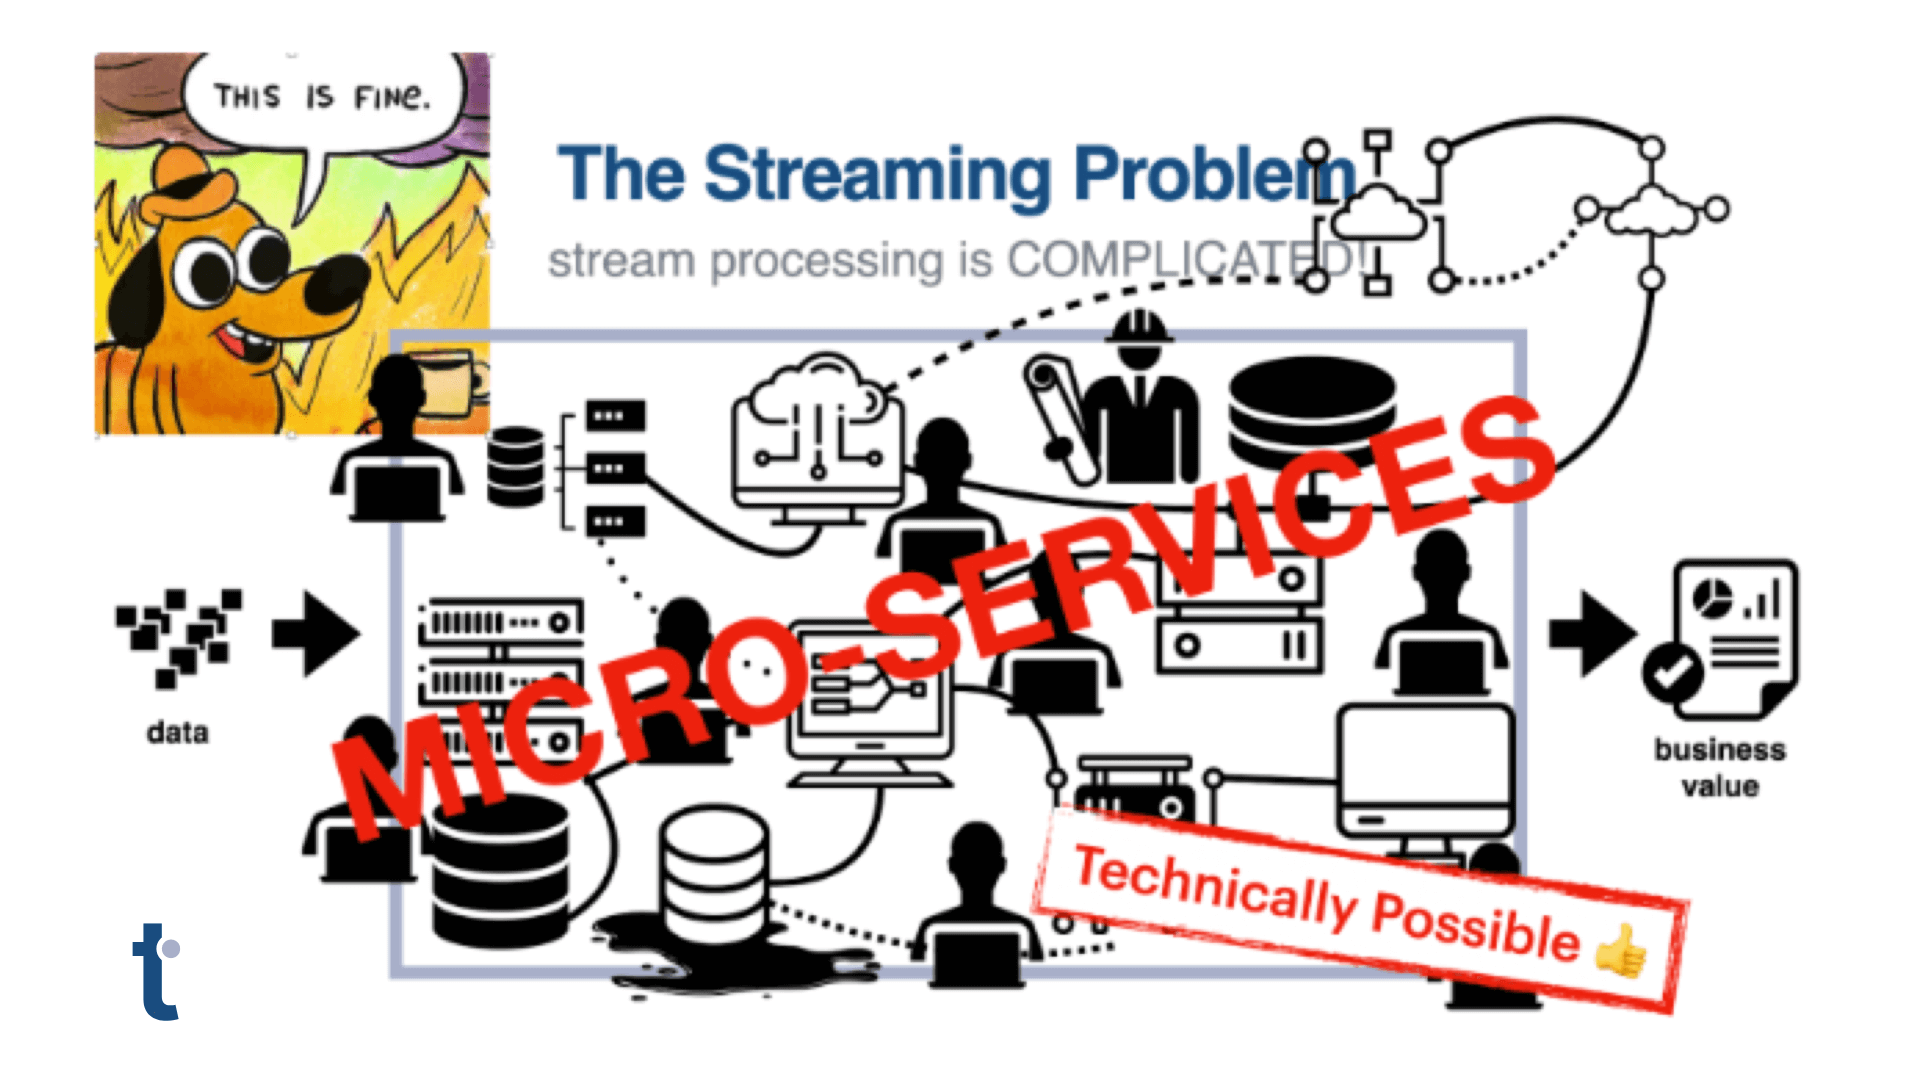
One thing these events have exposed is that the financial industry largely relies on an approach to managing mandated operational risk capital requirements, batch processing, that is ill-suited to the direction both the market and compliance are heading. Operationally, batch processing is time-consuming, costly, and often must take place in constrained time windows between market close and open.
The knock-on financial effect of the operation limitations of batch processing are more impactful: institutions are slow to react to changing market conditions, which can lead to over- or under-allocation of certain classes of funds.
Real-time Risk Calculation and Asset Allocation
Using Quine streaming graph, financial institutions can respond to market changes in real time, providing adequate coverage for risk exposure while ensuring compliance minimally affects asset allocation.
At a high level, Quine accomplishes this by doing what it does best: combining multiple feeds in real-time to build hierarchical models of elements like markets, trading entities, risk classes, and asset values, that adjust in real time to changing market conditions.
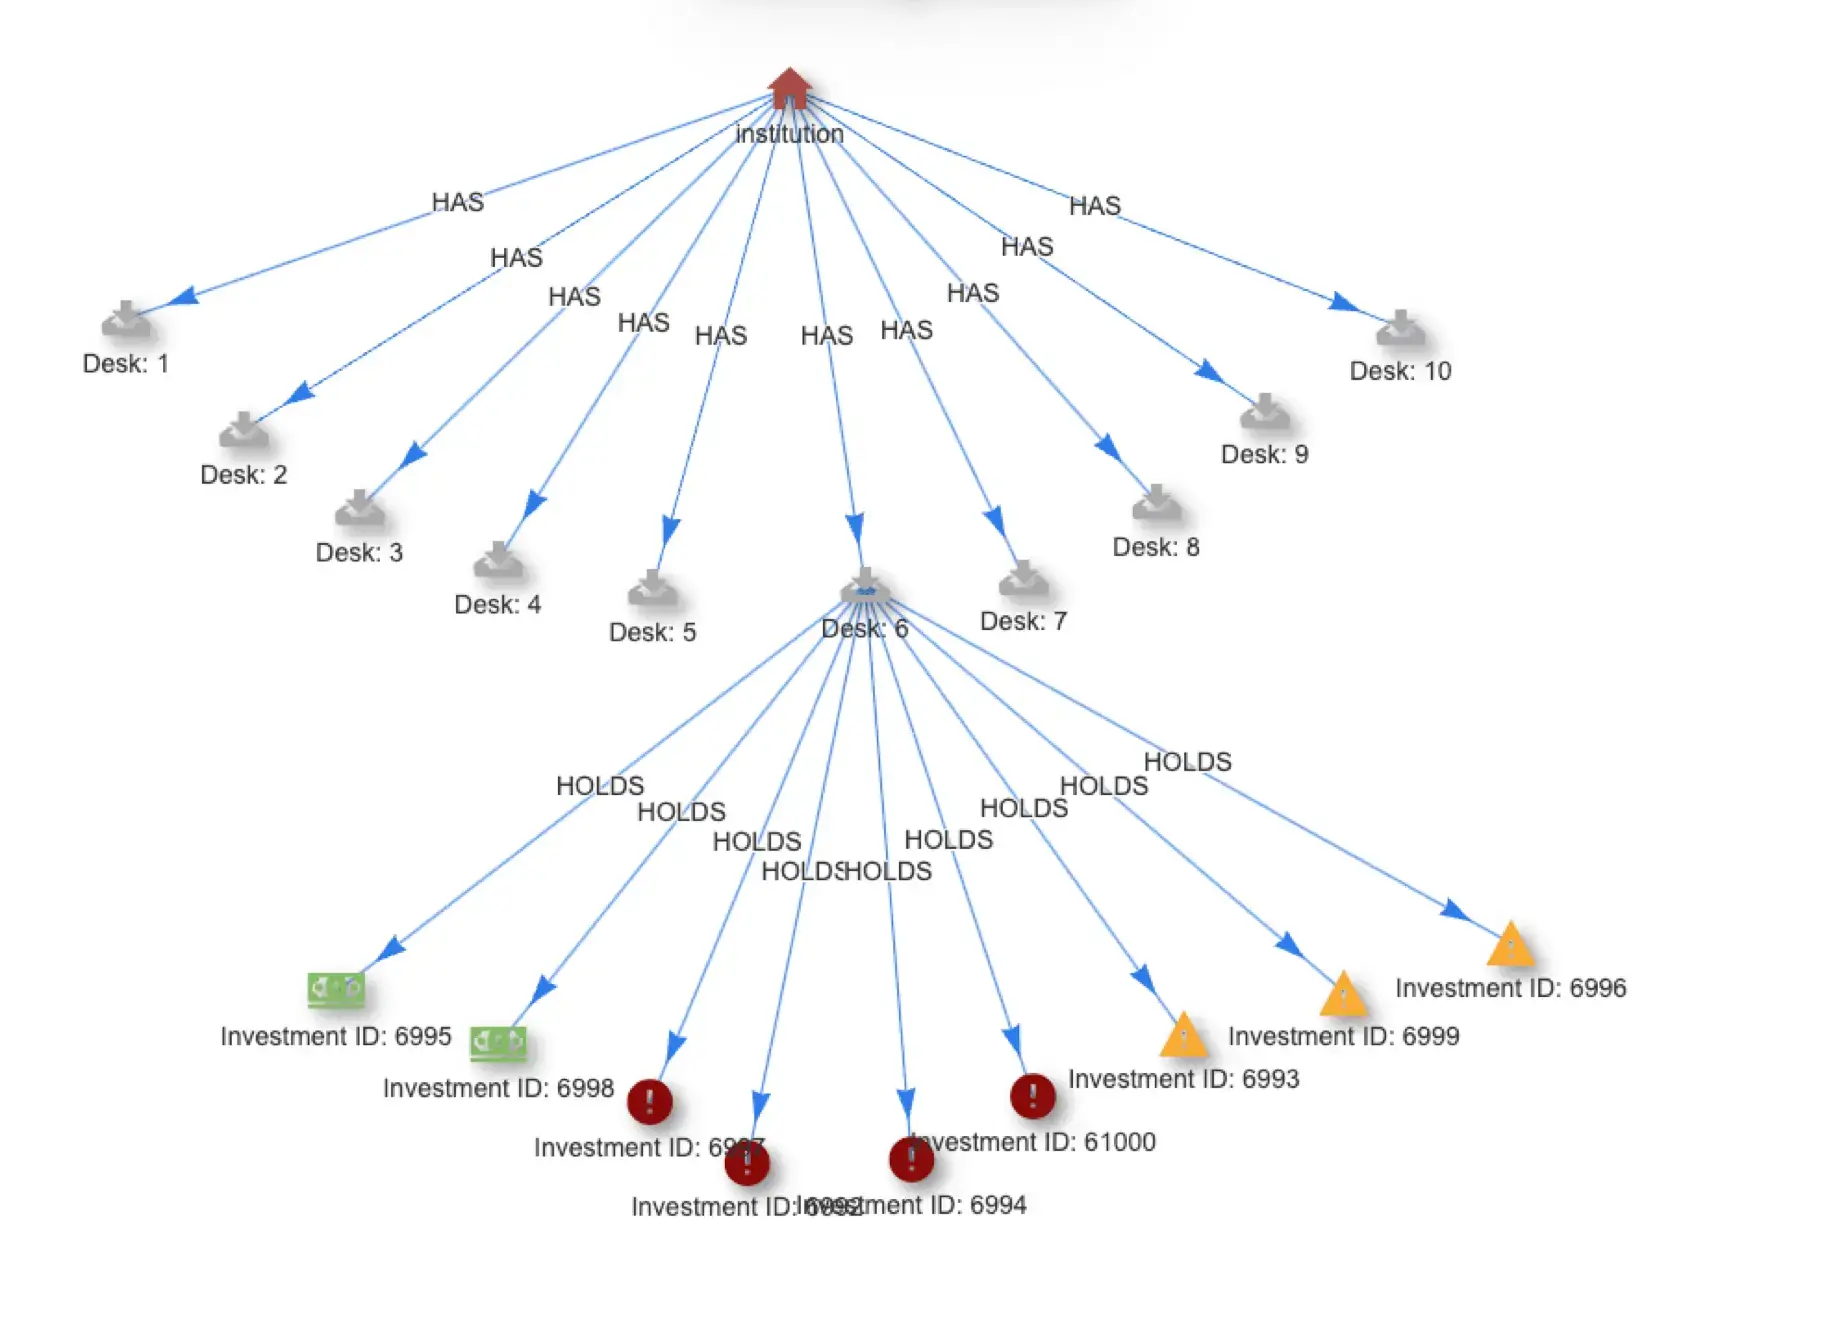
At a specific level, we have created a Quine recipe that demonstrates, in the context of regulatory monitoring requirements like the Basel III Liquidity Coverage Ratio (LCR), Net Stable Funding Ratio (NSFR) and liquidity risk monitoring tools as described in https://www.bis.org/bcbs/basel3.htm, the following:
- Calculating risk while taking into account complex interdependencies and rules.
- Constantly recomputing liquidity-indexed risk to determine capital requirements relative to market conditions.
- Normalizing multiple sources to calculate relative value of assets and roll up the results to determine near-real time liquidity in event liquidation is necessary.

A sample view from the graph this recipe generates.
The recipe can be found here.
Quine Developer Site 2.0
As part of our continued focus on improving the Quine developer experience, we’ve made significant changes to the Quine.io site.
The most notable change is a total restructuring of the recipe pages to interleave code and contextual or documentary information. Recipe documentation now includes a full walkthrough of a recipe and an explanation of how the recipe works so that recipes can also act as training material.

The new, more structured recipe page.
Other changes include:
- Improved developer journey by separating tutorials (getting started), technical docs, and recipe docs into their own sections of the site
- Full release notes and release history included in the downloads page
- Direct links to Quine blog posts, events, and self-service demos are now on the info page
You can still download and easily get started with Quine (hint, hint) and we’d love to hear your feedback and add features you think might help you build great things with Quine.