Existing software has forced people to choose between asking deep questions or getting their answers fast. Graph databases can do some pretty amazing things, but they’re not known for their analytical speed. If you want powerful fraud detection or cybersecurity threat detection, graph data analysis is a good choice. But if you need it fast, to turn that into fraud prevention and cybersecurity threat protection, graph databases are not a good choice. Streaming analytics makes sense to get the immediate level of speed that you need. But most event stream processing frameworks analyze data as if it were a standard row and column coming in one message/row at a time. That means they’re not ideal for things like fraud detection and cybersecurity that require complex relationship, pattern, and anomaly type analysis.
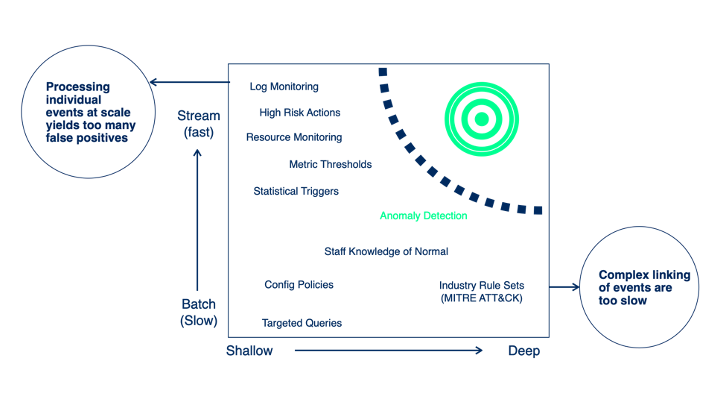
Example in cybersecurity of being forced to choose between deep slow graph database analytics and fast shallow streaming analytics when what you need is fast deep analytics.
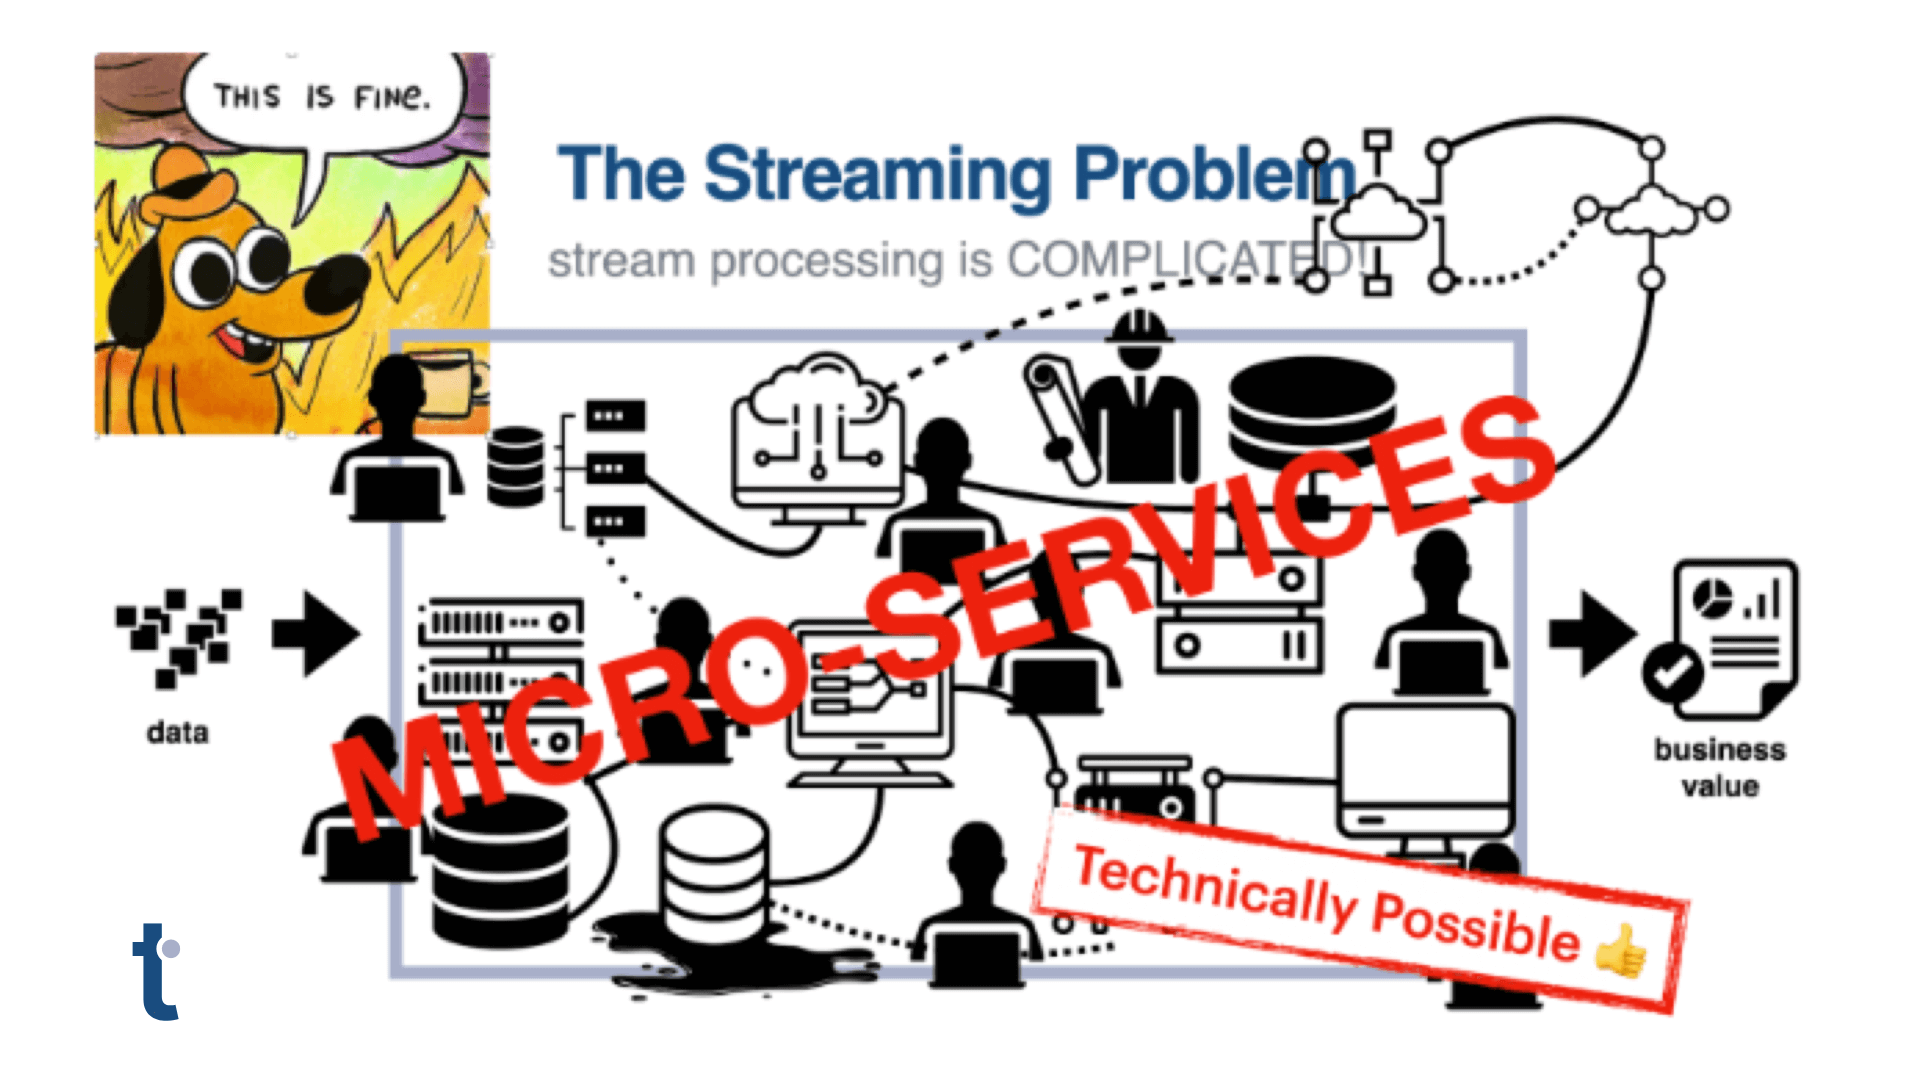
You could do streaming analytics or you could do graph analytics, but not both. What you need to solve a lot of tough problems is event stream processing that sees the flowing data as a graph. That’s what thatDot does. It’s unique in the industry as far as I know. Being a pioneer can be a major problem because folks don’t know where you fit or what to compare you to. In particular, since there aren’t other options out there, why is this something you might need? Previous technology is like the guy who lost something, and looks where there’s adequate light, even though he knows it wasn’t lost there. It doesn’t really work, but making do with what you have is the only option.
Event stream processing in graph form shines the light where you need it, in fast deep streaming analytics. Here are four advantages of doing graph analysis in an event stream that come immediately to mind:
1. Shift analysis left for smart filtering. Because the data can be transformed and analyzed while it’s still flowing, you can intelligently filter out data you don’t want, even resolve duplicates from multiple data streams before dropping the masses of data into expensive databases. In the case of IoT, it can shift left all the way to the edge, and only push sensor notifications that matter. Instead of 1000 useless identical readings and three different readings, only the data that matter are sent on for analysis or action.
2. Ask deep relationship questions on the fly. The questions most event processors can ask do not dig deep into relationships and patterns simply because that’s not how they look at data. Finding the entities, properties, and analyzing the relationships to find important patterns on the fly is what streaming graph excels at.
3. Analyze categorical data without turning it into numeric data first. A lot of important data is categorical, such as IP addresses, names, and location information. State of the art without graph streaming analytics is to first convert that data into wide, sparse numerical information, then do analysis on that bloated numeric data, then turn it back into categorical data to return an answer. (All our tools only work on numbers, so let’s only look there.) thatDot Streaming Graph lets you analyze categorical data as categorical data, immediately. No delay while you land and fiddle with the data so your tools can analyze it.
4. Reduce mean time to value (MTTV). Get actionable answers immediately, sub-milliseconds. Landing the data in a graph database, cleaning and preparing the data, then finally doing some analyses and visualizing it takes time.
Doing graph analysis right in your event stream reduces the time to get answers from hours to seconds, or from seconds to milliseconds. This can mean the difference between fraud detection and fraud prevention, between finding out you were breached and catching a cybercriminal in the act. To learn more, check out https://www.thatdot.com/. You’d be surprised at what is possible now.