The depth of graph analytics.
The speed and throughput of event stream processing.
Instantly turn high-volume, complex data streams into insights and automated actions with the industry’s only real-time streaming graph engine.
Data and Security Products Face Impossible Compromises
Traditional approaches buckle under volume, velocity, and complexity, forcing impossible choices:
Deep Analysis
But Too Slow
Detect sophisticated attacks only after the damage is done.
Fast Insights
But Too Shallow
Miss multi-stage patterns hidden across time and sources.
PROCESSING AT A
Limited Scale
Pre-filtering your data = missed results and reduced adaptability
Deliver All Three With Quine
Quine Streaming Graph is the only real-time streaming graph engine,
purpose-built for the demands of modern, data-intensive security platforms.
Developed with DARPA.
Battle-tested by CrowdStrike, the U.S. Air Force, U.S. Navy, and others.

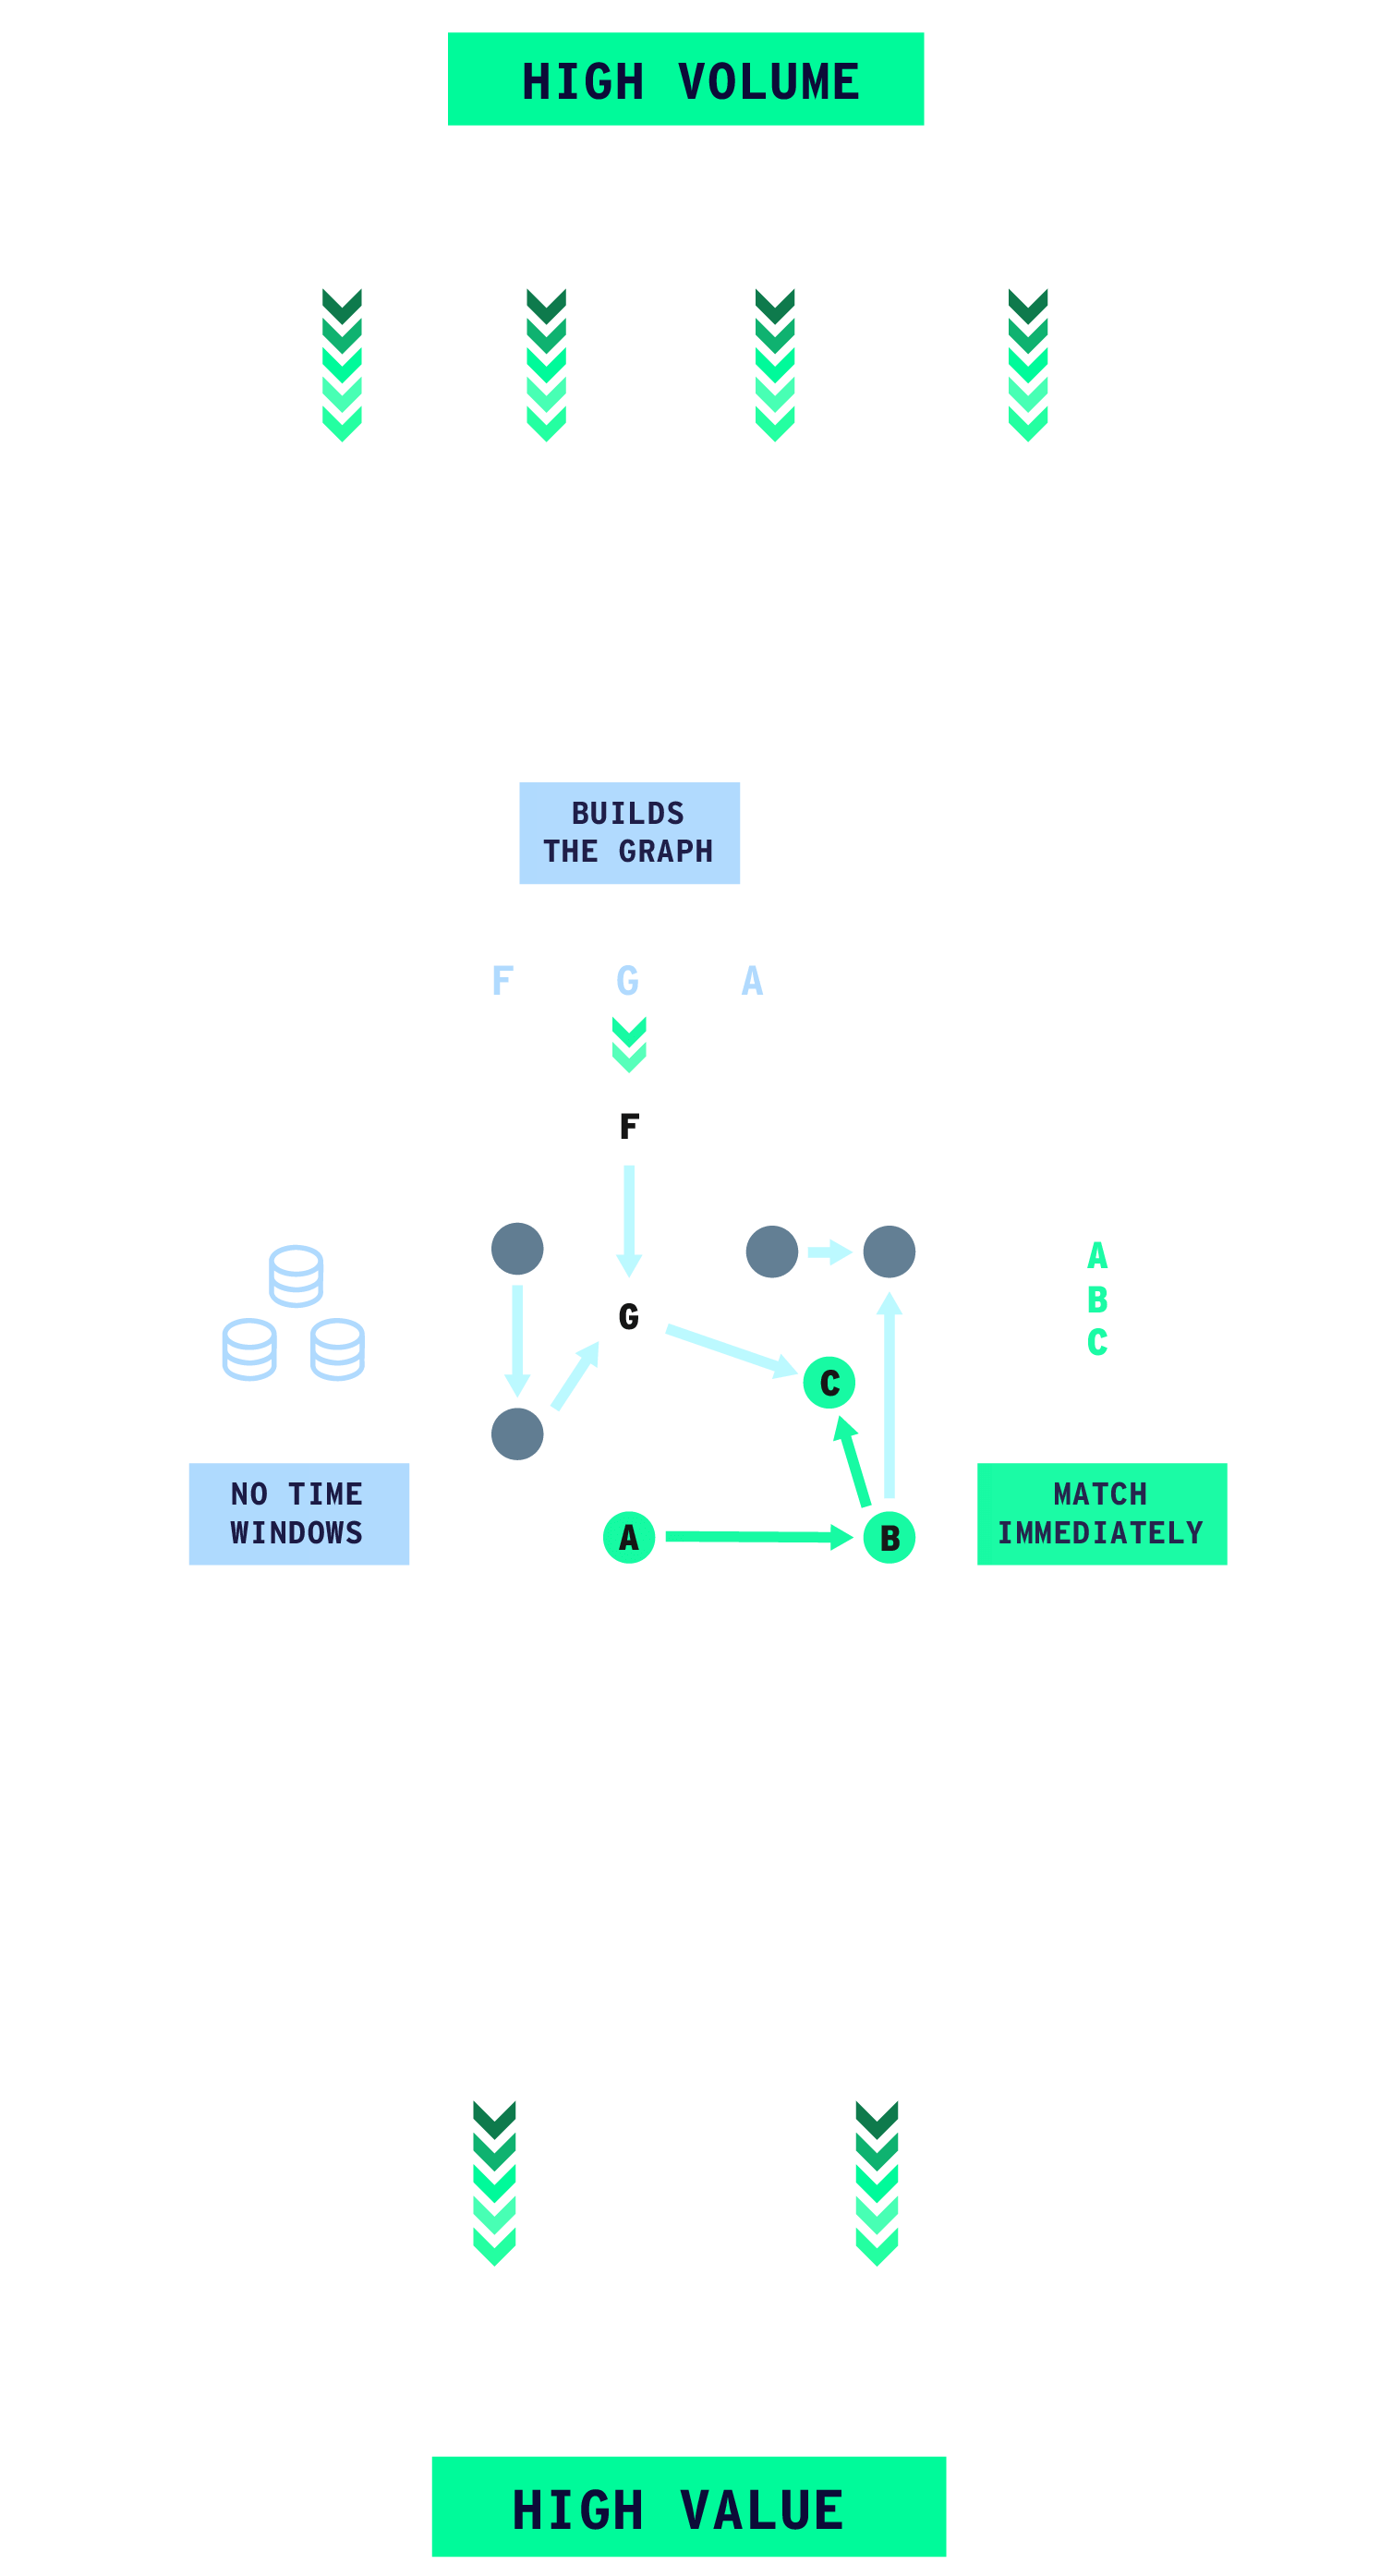
High Volume
Ingest and analyze internet-scale data streams (>1M events/sec) alongside historical context without dropping data or compromising depth.

Deep Questions
Instantly identify complex, multi-hop patterns (10, 20, 100+ hops) indicative of risk, fraud, or opportunity, even across months or years of data.

Fast Answers
Deliver sub-second insights and trigger immediate automated responses the moment a critical pattern emerges.
No need to choose. Deliver speed, depth, and scale simultaneously with Quine.
Trying Quine on your data pipeline is as easy as running a single shell command.
The Power of Quine
USE ALL YOUR DATA
High Volume
Ingest and Process Data at Scales previously impossible with graph analytics.
Process massive data streams
Ingest data from diverse sources like Apache Kafka, AWS Kinesis, Pulsar, SQS, files, and APIs at sustained rates beyond 1 million events per second per cluster.
Combine real-time and historical context
Merge live event streams with historical data in the graph or fetched from external datastores. Quine eliminates the need for time windows, allowing analysis across long durations (days, months, even years) to detect complex attack patterns over time.
Build graphs of unlimited size
Quine’s distributed architecture is built for horizontal scaling. It also includes built-in mechanisms to efficiently handle supernodes (nodes with extremely high edge counts) without performance degradation.
Ensure stability with built-in backpressure
Quine’s fully backpressured stream processing dynamically adjusts throughput, preventing data loss and ensuring system stability even when dealing with bursty traffic or slower downstream components.
UNDERSTAND ALL YOUR DATA
Complex Patterns
Ask deep questions of connected data, enabling detection of
sophisticated attacks that other approaches miss entirely.
Identify deeply connected patterns
Use the expressive power of the Cypher query language to define and detect complex event patterns spanning any number of connections across vast datasets. Uncover sophisticated or subtle behavioral correlations invisible to simpler rule engines and conventional analytics.
Leverage categorical data directly
Process high-cardinality categorical data natively, maintaining the rich context that reveals sophisticated attacks.
Handle out-of-order and late-arriving data
Quine’s event-driven, stateful architecture means patterns are matched automatically and incrementally as data arrives. The order or timing doesn’t matter; You can identify patterns even with significant delays, ensuring accuracy without performance hits or complex data re-ordering pipelines.
Apply graph algorithms & AI/ML to streaming data challenges
Integrate built-in graph algorithms (like random walks for GNN training via Node2Vec/GraphSAGE approaches) or custom AI/ML models directly into your stream processing. Perform real-time anomaly detection, pathfinding, root cause analysis, and more on the live graph.
ANALYZE ALL YOUR DATA
Low Latency
Get fast answers and trigger real-time actions the moment a full threat pattern emerges.
Millisecond latency
Ingest data from diverse sources like Apache Kafka, AWS Kinesis, Pulsar, SQS, files, and APIs at sustained rates beyond 1 million events per second per cluster.
Analyze in real-time, not offline processing
Quine’s efficient incremental processing allows graph analytics that were previously confined to slow, offline batch jobs (like complex risk calculations or post-breach attack path analysis) to run continuously within the live data stream, delivering results in microseconds vs hours at a drastically reduced cost.
Stream results instantly with Standing Queries
Quine eliminates the need for batch processing and inefficient polling. Standing queries emit results or trigger downstream actions (via Kafka, Kinesis, webhooks, custom code) the moment a specified pattern completes, enabling genuine real-time, event-driven workflows across massive, connected data streams.
Get Started with Quine Recipes
Trying Quine on your data pipeline is as easy as running a single shell command.
Enterprise-ready
Ready to upgrade? Quine Enterprise is built for scale, reliability, and seamless integration.
Horizontal scalability
Scale clusters seamlessly across commodity hardware or cloud instances (including Kubernetes) to handle any data volume or query complexity. Demonstrated scaling past 1 million events per second.
High availability
Designed with automated failure detection, instant failover, cluster management, and efficient state recovery. Backpressured and verified to ensure no data is ever lost, even if hardware fails.
Flexible persistence
Intelligently manages data between fast in-memory processing and durable disk storage. Integrate with your existing persistence solutions (Cassandra, RocksDB, Clickhouse, etc) or let Quine manage optimized storage for reduced integration friction.
Data durability
Benefit from the replication and durability features of your chosen persistence layer for robust data protection and disaster recovery strategies.
Role-based access
Connect to your enterprise directory service to provide fine-grained access control so every user can do just what they are supposed to, and no more.
Deployment flexibility
Automatically scales up to use resources available on each machine or scales down to deploy at the edge on a device as small as a Raspberry Pi.
See complete Open Source vs Enterprise comparison here.
Novelty Detector: Real-Time Anomaly Detection
thatDot’s own Novelty Detector product is built on top of Quine to harness the powers of streaming graph analysis for anomaly detection on categorical data. By building a dynamic probabilistic graph model on the fly, Novelty Detector fingerprints every ideosyncrasy of every object in the graph to identify truly anomalous behaviors, exaplin with context, and avoid false positives – a feat impossible for traditional anomaly detection.
Novelty Detector enables powerful use cases like insider threat detection, zero-day exploit discovery, and sophisticated fraud prevention.