NOVELTY DETECTOR: CONTEXT AWARE ANOMALY DETECTION
Detect unknown threats in real-time
Find the truly novel events hidden within massive streams of data: instantly, accurately, and without manual training or labeled data.
Traditional security and monitoring falls short
Your existing security and monitoring tools are
drowning in data, yet missing critical anomalies. Why?
Limited to Numerical Data
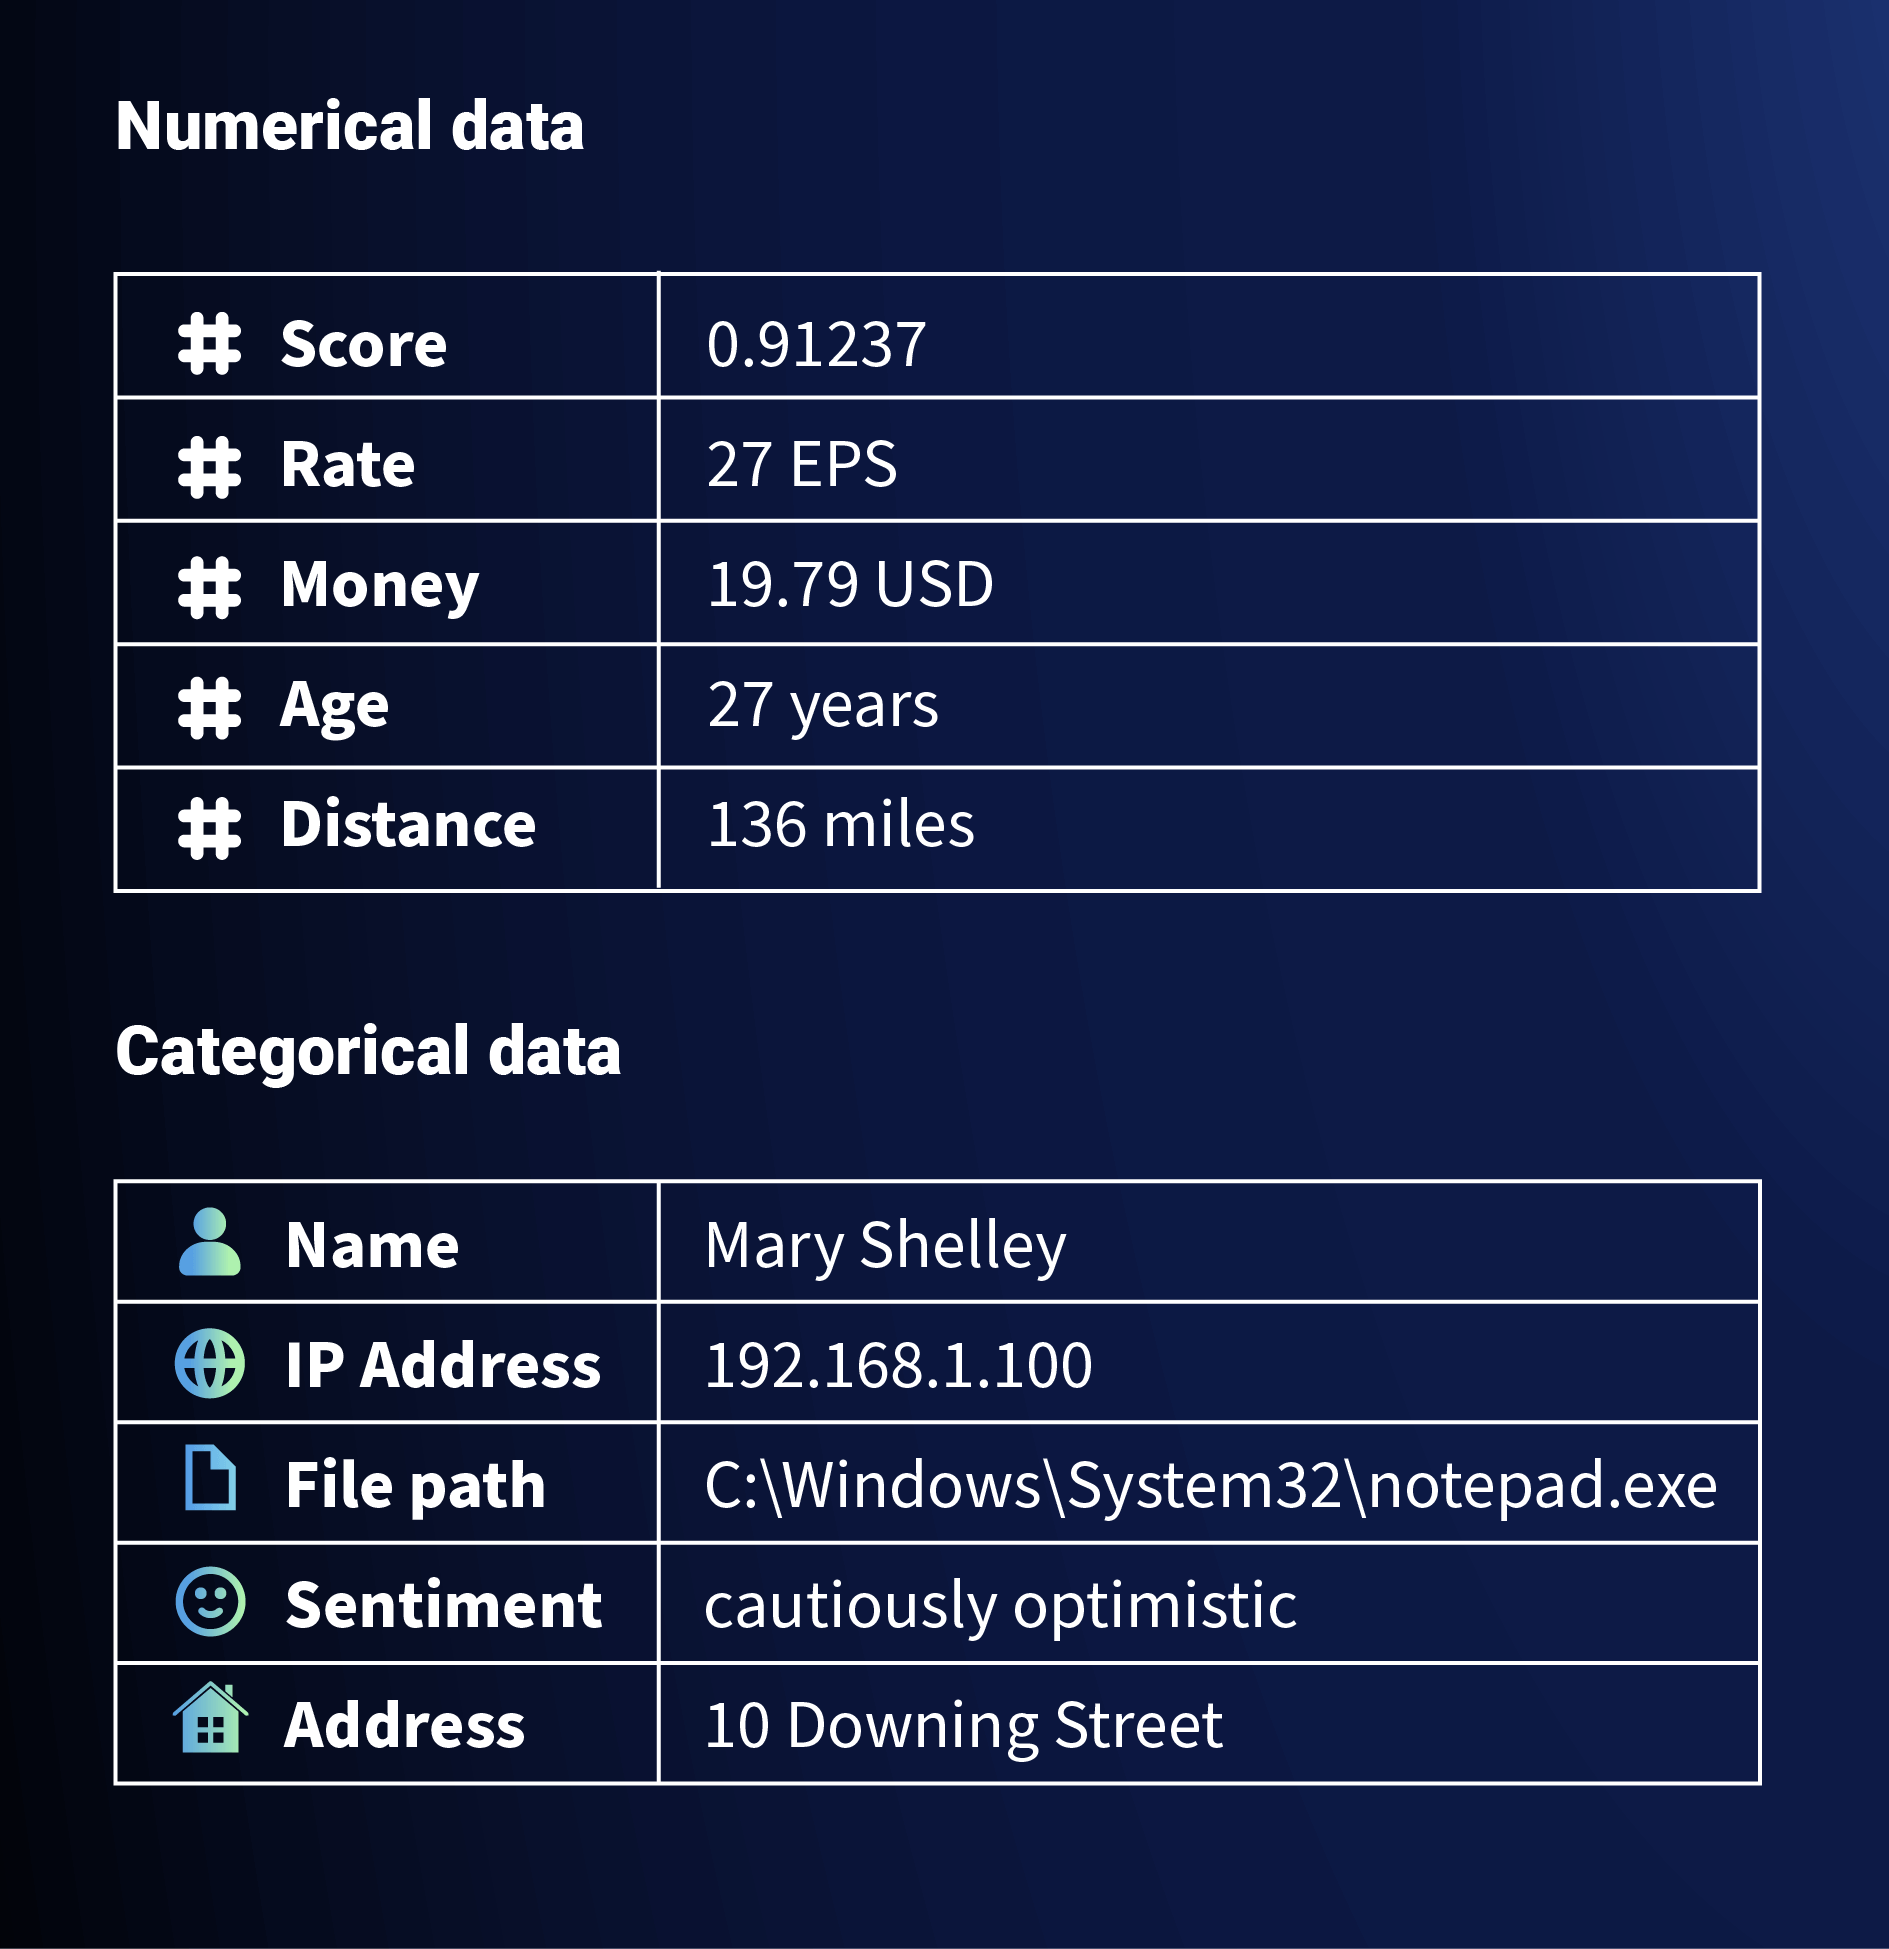
Traditional anomaly detection struggles with non-numeric (categorical) data like IP addresses, user IDs, file paths, and API calls. Encoding this rich data into numbers is lossy, destroys context, and often fails due to the “curse of dimensionality.”
Data Filtering
To mitigate too-much-data, most engineers find a clever way to pre-filter data before it’s analyzed. This often leads to missed results, and even if it works the first time, filtering means missing the important events you didn’t anticipate.
False Positives
Threshold-based alerting on numerical data creates a storm of false positives, burying real threats in noise and leading to analyst burnout.
Batch Delays
Waiting hours or days for batch analysis means you detect threats only after the damage is done.
Training Bottlenecks
Supervised ML requires laborious data labeling and constant retraining, making it slow to adapt and ineffective against zero-day threats or evolving insider tactics.
See what others can’t with
thatDot Novelty Detector
thatDot Novelty Detector is a new kind of anomaly detection engine, built upon the high-performance Quine Streaming Graph platform. With Novelty, you can find and rank the important events you didn’t know to look for, in ALL your data.
How Novelty Works
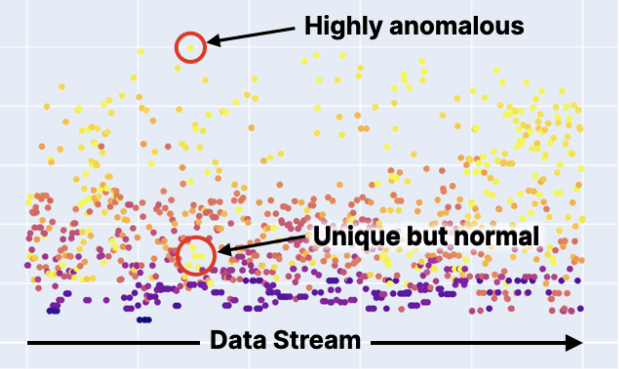
Novelty Detector continuously learns the “normal” behavioral fingerprint of your unique environment directly from your data streams – unsupervised and instantly. It goes beyond just flagging statistical outliers; it identifies truly novel events that deviate from learned patterns, while intelligently distinguishing them from merely unique but expected occurrence. Then it ranks each event and explains the context of what made each event important.
Key Capabilities
Detect unknown unknowns
Proactively uncover zero-day exploits, insider threats, and novel fraud schemes without relying on pre-defined signatures or rules. Unsupervised, self-learning AI dynamically identifies deviations from normal behavioral patterns.
Dramatically reduce false positives
Just because it’s new doesn’t mean it’s novel. Contextual fingerprinting distinguishes what is truly novel from what is just previously unseen. Increase SOC/NOC efficiency, reduce alert fatigue, and focus analyst attention on genuine threats, leading to faster, more accurate responses.
Unlock insights from categorical data
Gain deeper insights and detect threats hidden within the rich contextual information that comprises the majority of your event data. Natively processes high-cardinality categorical data (IPs, user IDs, file paths, hostnames, etc.) without lossy encoding.
Real-time, explainable scoring
Enable immediate, confident investigation and trigger automated responses (e.g., via SOAR integration) based on high-fidelity alerts. Provides millisecond-latency novelty scores with explanations pinpointing why an event is anomalous.
Rapid deployment and adaptation
Deploy quickly and adapt automatically to evolving environments and threats without disruptive and time-consuming retraining cycles. No manual data labeling or batch training required. Learns continuously from live data streams.
Novelty Detector
Use Cases
Cybersecurity
Monitor network, device, user, and application data for unusual configuration changes or access patterns.
Network optimization
Identify network route inefficiencies, and eliminate redundant alerts through topology awareness.
Fraud detection
Analyze usage for excess concurrent usage, and generate events to enforce entitlement compliance.
Log data reduction
Intelligently filter log data to eliminate the huge bulk of uninformative data. Highlight what’s important and make use of all of your logs intelligently.
General anomaly detection
Black swan events and unknown unknowns can be extremely hard to detect since you don’t know what to look for. Novelty finds them and increases your knowledge about your data.
Edge system abnormalities
Filter away the bulk of irrelevant readings to spotlight potential problems for predictive maintenance, smart metering, asset monitoring, process automation, and improving customer experiences.
Ready to detect the undetectable?
Find the real threats hidden in your data.
See how thatDot Novelty Detector can provide unparalleled visibility
into your categorical data streams.
Enterprise-ready
Built on the revolutionary Quine Streaming Graph platform,
Novelty Detector inherits enterprise-ready capabilities:
Horizontal scalability
Seamlessly scale to handle massive event volumes from diverse sources.
Flexible integration
Simple REST API enables easy integration into existing data pipelines, SIEMs, SOAR platforms, and monitoring tools.
Data durability
Pre-process raw data streams directly within Novelty Detector, simplifying your pipeline.
Streaming results
Publish results in real-time to integrate with other streaming systems and find important events immediately.

